Fig. 4
Download original image
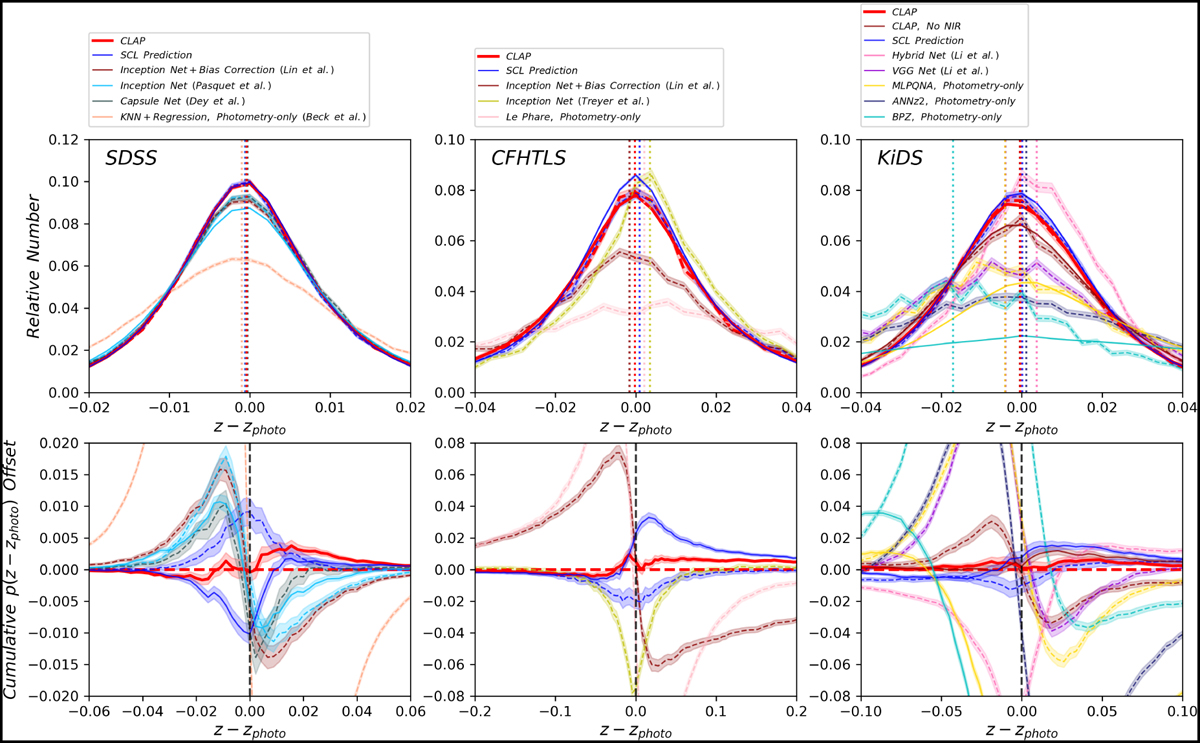
Distribution offset analysis for the SDSS, CFHTLS, and KiDS target samples. The results obtained by CLAP are compared with the prediction from our supervised contrastive learning (SCL) framework, and those produced by a few benchmark image-based methods including inception networks from Pasquet et al. (2019) and Treyer et al. (in prep.), network-based bias correlation from Lin et al. (2022), a capsule network from Dey et al. (2022a), a VGG network, and a hybrid network from Li et al. (2022a), and the photometry-only methods including KNN & regression from Beck et al. (2016), Le Phare (Arnouts et al. 1999; Ilbert et al. 2006), as well as MLPQNA (Brescia et al. 2014; Cavuoti et al. 2015, 2017), ANNz2 (Sadeh et al. 2016; Bilicki et al. 2018), and BPZ (Benítez 2000) retrieved from the public KiDS catalogues. For the KiDS dataset, the results obtained by CLAP but without the NIR data are also shown (‘No NIR’). For both CLAP and the SCL prediction, the ensemble of ten probability density estimates are combined using the harmonic mean. Upper panels: z − zphoto distributions. The solid curves show the stacked recentred probability densities pΣ (z − zphoto) for the methods that have probability density estimation. The dashed curves show the zspec − zphoto histograms for all the methods. The error bands are estimated using bootstrap. The vertical dashed lines show the median of zspec − zphoto for each method, indicating the centre of each zspec − zphoto distribution regardless of the random errors due to limited statistics at high redshift. Lower panels: Cumulative z − zphoto distribution offsets. The solid curves show the cumulative offset of the stacked recentred probability density pΣ(z − zphoto) relative to the corresponding zspec − zphoto histogram for each method that has a probability density estimation (i.e. ![]() ). The dashed curves show the cumulative offset of the zspec − zphoto histogram for each of all the methods (including No-NIR CLAP for the KiDS dataset) relative to that obtained by default CLAP (i.e. ∆Fh–h). The error bands are estimated using bootstrap. The vertical dashed line in each panel indicates the zero point where z and zphoto coincide.
). The dashed curves show the cumulative offset of the zspec − zphoto histogram for each of all the methods (including No-NIR CLAP for the KiDS dataset) relative to that obtained by default CLAP (i.e. ∆Fh–h). The error bands are estimated using bootstrap. The vertical dashed line in each panel indicates the zero point where z and zphoto coincide.
Current usage metrics show cumulative count of Article Views (full-text article views including HTML views, PDF and ePub downloads, according to the available data) and Abstracts Views on Vision4Press platform.
Data correspond to usage on the plateform after 2015. The current usage metrics is available 48-96 hours after online publication and is updated daily on week days.
Initial download of the metrics may take a while.