Fig. 5
Download original image
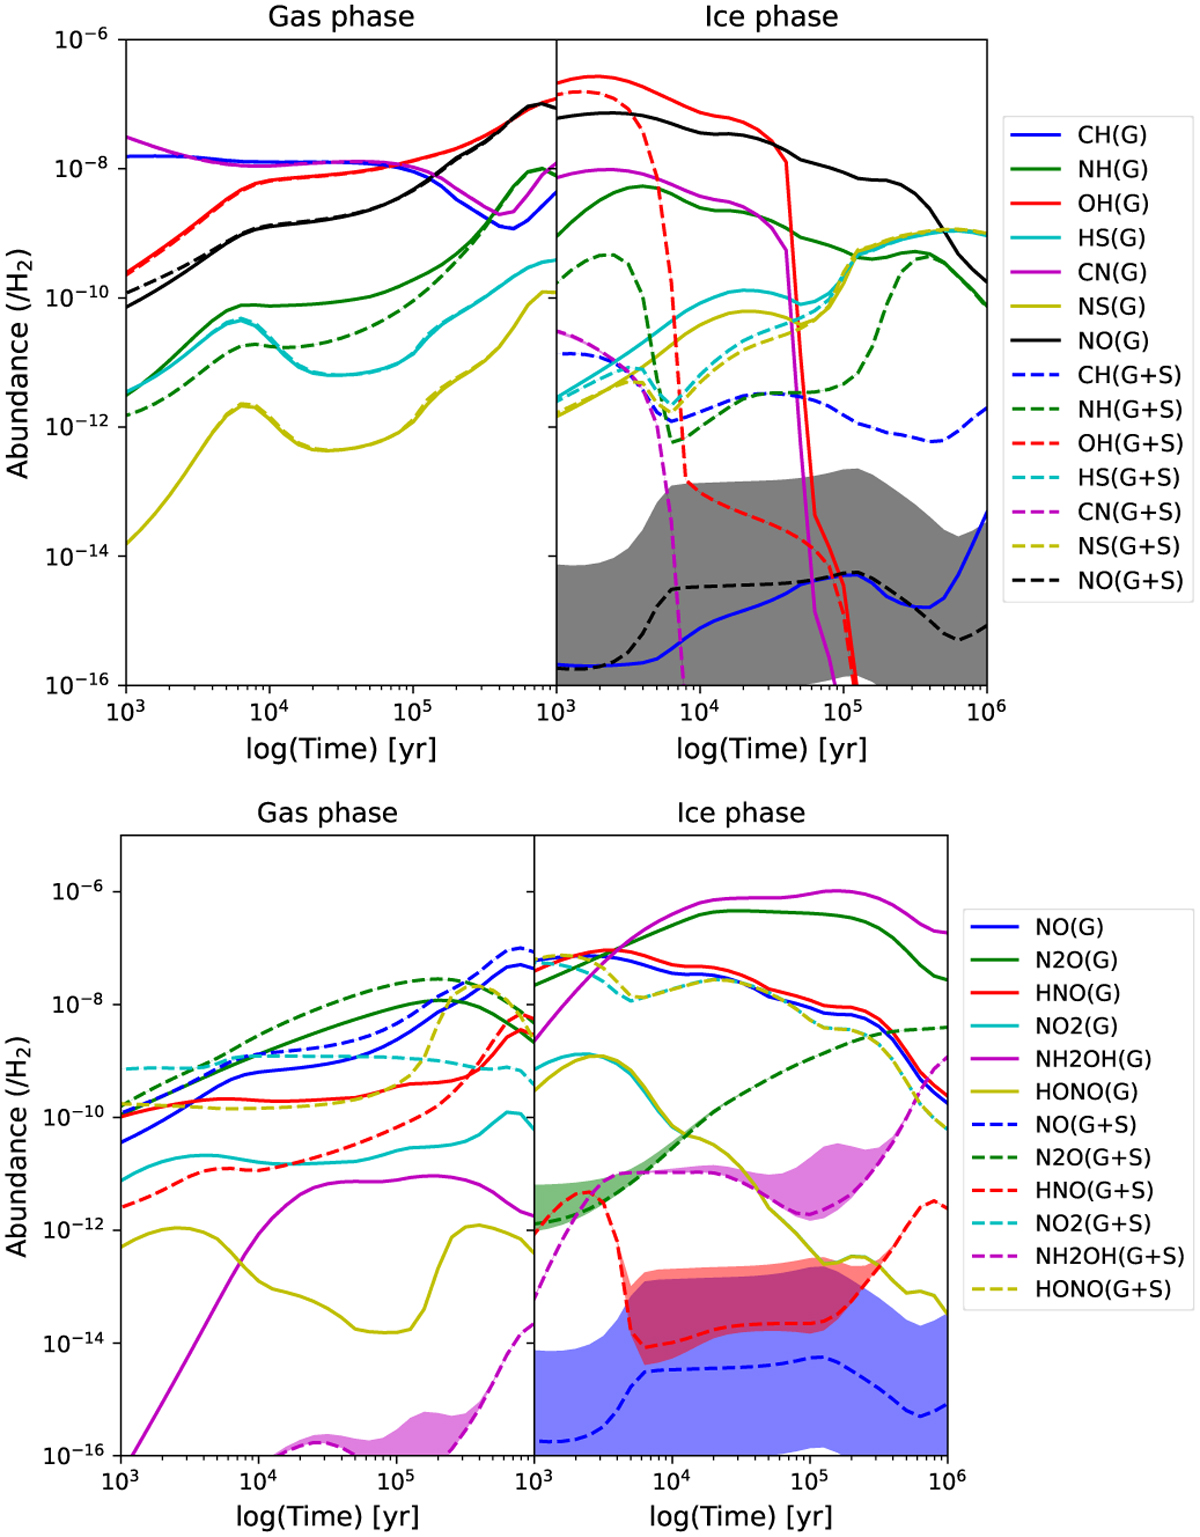
Changes in the abundances of gas- and ice-phase radicals over time in a dark cloud. The solid lines represent the results obtained using the BE values from Garrod (2013, “G”), while the dashed curves represent the results obtained using our calculated BE values (“G+S”). The filled curve around the calculated BE curves shows the abundances when the errors on the calculated BEs are taken into account, as presented in Table 2.
Current usage metrics show cumulative count of Article Views (full-text article views including HTML views, PDF and ePub downloads, according to the available data) and Abstracts Views on Vision4Press platform.
Data correspond to usage on the plateform after 2015. The current usage metrics is available 48-96 hours after online publication and is updated daily on week days.
Initial download of the metrics may take a while.