Fig. 4
Download original image
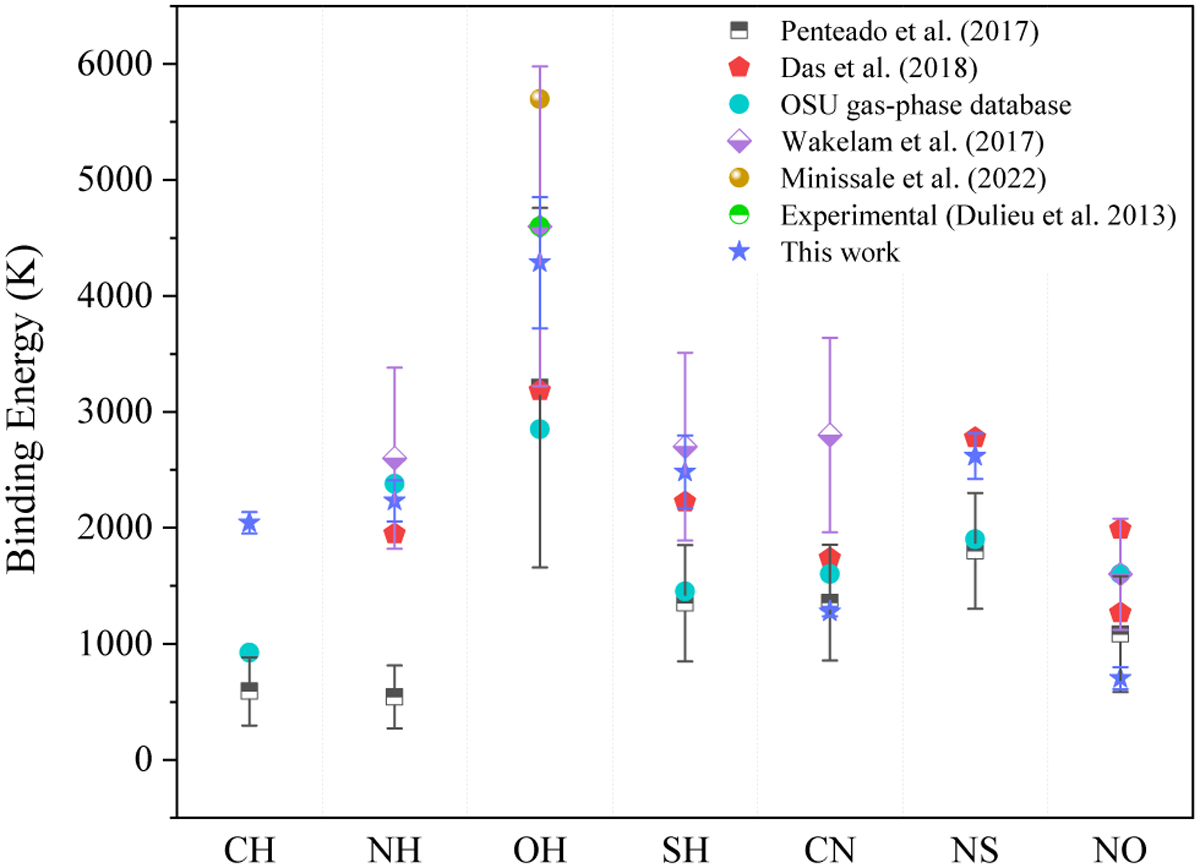
Comparison of the BEs computed in the present work (blue stars) and those based on the available literature and frequently used databases noted in Table 2. The solid lines go from the minimum to the maximum BE values for each species. Only the OH radical has reported experimental data (green circle). The dashed gray vertical lines guide the eye to identify the corresponding species.
Current usage metrics show cumulative count of Article Views (full-text article views including HTML views, PDF and ePub downloads, according to the available data) and Abstracts Views on Vision4Press platform.
Data correspond to usage on the plateform after 2015. The current usage metrics is available 48-96 hours after online publication and is updated daily on week days.
Initial download of the metrics may take a while.