| Issue |
A&A
Volume 690, October 2024
|
|
|---|---|---|
| Article Number | A327 | |
| Number of page(s) | 6 | |
| Section | Stellar structure and evolution | |
| DOI | https://doi.org/10.1051/0004-6361/202451473 | |
| Published online | 21 October 2024 | |
Testing the asteroseismic estimates of stellar radii with surface brightness-colour relations and Gaia DR3 parallaxes
Red giants and red clump stars
1
Dipartimento di Fisica “Enrico Fermi”, Università di Pisa, Largo Pontecorvo 3, 56127
Pisa, Italy
2
INFN, Sezione di Pisa, Largo Pontecorvo 3, 56127
Pisa, Italy
Received:
12
July
2024
Accepted:
9
September
2024
Abstract
Aims. We compared stellar radii derived from asteroseismic scaling relations with those estimated using two independent surface brightness-colour relations (SBCRs) combined with Gaia DR3 parallaxes.
Methods. We cross-matched asteroseismic and astrometric data for over 6400 red giant branch (RGB) and red clump (RC) stars from the APO-K2 catalogue with the TESS Input Catalogue v8.2 to obtain precise V band magnitudes and E(B − V) colour excesses. We then adopted two different SBCRs from the literature to derive stellar radius estimates, denoted as Ra and Rb, respectively. We analysed the ratio of these SBCR-derived radii to the asteroseismic radius estimates, R, provided in the APO-K2 catalogue.
Results. Both SBCRs exhibited good agreement with asteroseismic radius estimates. On average, Ra was overestimated by 1.2% with respect to R, while Rb was underestimated by 2.5%. For stars larger than 20 R⊙, SBCR radii are systematically lower than asteroseismic ones. The dispersion in the radius ratio was similar for the two methods (around 10%). The agreement with asteroseismic radii shows a strong dependence on the parallax. The dispersion is halved for stars with a parallax greater than 2.5 mas. In this subsample, Rb showed perfect agreement with R, while Ra remained slightly overestimated, by 3%. A trend with [Fe/H] was found at a level of 4% to 6% per dex. Additionally, a clear trend with asteroseismic mass is found. For stars less massive than about 0.95 M⊙, SBCR radii were significantly higher than asteroseismic ones, by about 6%. This overestimation correlated with the presence of extended helium cores in these stars’ structures relative to their envelopes. Furthermore, radius ratios showed a dichotomous behaviour at higher masses, mainly due to the presence of several RC stars with SBCR radii significantly lower with respect to asteroseismology. This behaviour originates from a different response of asteroseismic scaling relations and SBCR to [α/Fe] abundance ratios for massive stars, both in RGB and RC phases, which is reported here for the first time.
Key words: methods: statistical / stars: evolution / stars: fundamental parameters / stars: interiors
Corresponding author; This email address is being protected from spambots. You need JavaScript enabled to view it.
© The Authors 2024
 Open Access article, published by EDP Sciences, under the terms of the Creative Commons Attribution License (https://creativecommons.org/licenses/by/4.0), which permits unrestricted use, distribution, and reproduction in any medium, provided the original work is properly cited.
This article is published in open access under the Subscribe to Open model. This email address is being protected from spambots. You need JavaScript enabled to view it. to support open access publication.
1. Introduction
Accurate measurements of stellar masses and radii are crucial to constraining stellar structure and evolution models. High-quality measurements of these parameters can be obtained from detached double-lined eclipsing binaries, so these systems are routinely adopted to test stellar evolution models and to constrain their free parameters (see among many Andersen et al. 1991; Torres et al. 2010; Valle et al. 2017, 2023; Claret & Torres 2017).
Obtaining precise estimates of masses and radii from single stars is more problematic. Spectroscopic determinations of the effective temperature, surface gravity, and metallicity of a star, combined with a known parallax, can provide the stellar radius and luminosity. However, the strong dependence of the spectroscopic atmospheric parameters on the atmosphere models and on the method used for their derivation hamper firm predictions (see e.g. Torres et al. 2012; Coelho 2014; Ivanyuk et al. 2017; Branco et al. 2024). As a matter of fact, differences of about 60 K in effective temperature and 0.15 dex in log g exist between determinations from different surveys for red giant branch (RGB) stars (Hegedűs et al. 2023; Yu et al. 2023).
A different approach to evaluating the linear radius of a star is to combine an estimate of its angular radius with its distance, which has been made particularly attractive by the recent determination of accurate distances for over a billion stars from Gaia Data Release 3 (DR3; Gaia Collaboration 2021). Very accurate angular size measurements can be obtained with long-baseline interferometry (LBI; e.g. Nordgren et al. 1999; Mozurkewich et al. 2003; Baines et al. 2010; Gallenne et al. 2012; Lachaume et al. 2019; Perraut et al. 2020). However, LBI is limited to stars with angular diameters greater than about 0.5 mas (Gallenne et al. 2018), rendering it impractical for most targets. Surface brightness–colour relations (SBCRs) provide an efficient alternative for determining stellar angular diameters from photometric measurements. Essentially, SBCRs establish a link between a star’s angular size and its de-reddened brightness across various photometric bands. SBCRs are usually calibrated using samples of stars with well-determined LBI radii (see e.g. Kervella et al. 2004; Di Benedetto 2005; Salsi et al. 2021). More than 20 SBCRs exist in the literature, and many of them focus on the V and K bands, as this set of colours provides the lowest dispersion (Kervella et al. 2004). Comparisons among recent SBCRs have revealed a limited variability for late-type stars (e.g. Pietrzyński et al. 2019; Salsi et al. 2022; Nardetto et al. 2023). For instance, the comparison among 19 SBCRs performed by Nardetto et al. (2023) showed an agreement better than about 0.008 mag between 1.5 and 2.5 mag in V − K. The disagreement increased outside this range. SBCRs play a fundamental role in the distance determination of eclipsing binaries. As an example, a precise SBCR calibrated on 41 nearby red clump (RC) giant stars (Gallenne et al. 2018) has allowed the distance to the Large Magellanic Cloud to be estimated with a precision of 1% (Pietrzyński et al. 2019).
A new method for estimating stellar radii has emerged in recent years. The growth of observational asteroseismology, thanks to satellite missions such as Kepler and Transiting Exoplanet Survey Satellite (TESS; Borucki et al. 2010; Ricker et al. 2015), has opened a new way to estimate stellar properties of stars, such as mass, radius, and age. These data allow the RGB stellar radii to be estimated with a precision of about 4% (Pinsonneault et al. 2014; Martig et al. 2015; Valle et al. 2024). Notably, neither the distance from the observer nor the reddening influence the asteroseismic estimates. In fact, this method requires global seismic parameters, namely, the frequency of maximum power, νmax, a large frequency separation, Δν, and a determination of the stellar effective temperature. Given these ingredients, scaling relations yield the asteroseismic estimates of mass and radius (Ulrich 1986; Kjeldsen & Bedding 1995). While the validity of these scaling relations in the RGB phase has been questioned (e.g. Epstein et al. 2014; Gaulme et al. 2016; Viani et al. 2017; Brogaard et al. 2018; Buldgen et al. 2019), corrections accounting for the temperature and metallicity of the star have been proposed in the literature (e.g. Zinn et al. 2022; Stello & Sharma 2022). For stars with a metallicity [Fe/H] > −1.0, scaling relations are considered reliable (Epstein et al. 2014; Valentini et al. 2019; Schonhut-Stasik et al. 2024). In the following, we adopt asteroseismic radii as a reference. It is, however, important to clarify that we do not assume them to be the gold standard for radius determination. Disagreement in the measurement of radii from asteroseismic-corrected scaling relations and interferometric measurements have been reported by different authors, while other researchers have not found significant differences (see e.g. Hekker 2020; Thomsen et al. 2022, and references therein).
Given the relevant differences between asteroseismic and SBCR methods, a comparison of their results obtained when applied to a homogeneous sample is of particular interest. The recently released APO-K2 catalogue (Schonhut-Stasik et al. 2024) offers a great opportunity to perform this test, as this catalogue contains high-precision data of more than 7500 RGB and RC stars, combining spectroscopic (APOGEE DR17; Abdurro’uf et al. 2022), asteroseismic (K2-GAP; Stello et al. 2015), and astrometric (Gaia DR3; Gaia Collaboration 2021) data.
2. Adopted SBCRs and data selection
The surface brightness, Sλ, of a star is linked to its limb-darkened angular diameter, θ, and its apparent magnitude corrected from the extinction, mλ0. In the V band, SV is defined as
 (1)
(1)
where V0 is the V band magnitude corrected for extinction. From Eq. (1) it follows that
 (2)
(2)
Therefore, an estimate of the stellar linear radius is
 (3)
(3)
where d is the heliocentric distance of the star.
We adopted two different SBCRs. The first, proposed by Pietrzyński et al. (2019), is
![Mathematical equation: $$ \begin{aligned} {S\!}_V^a = 1.330 [(V-K)_0 - 2.405] + 5.869\,\mathrm{mag}, \end{aligned} $$](/articles/aa/full_html/2024/10/aa51473-24/aa51473-24-eq4.gif) (4)
(4)
where (V − K)0 is the colour corrected for reddening. This relation was fitted in a colour range (V − K)0 from 2.0 to 2.8 mag. The second SBCR we adopted for testing was proposed by Salsi et al. (2021). They used a slightly different formalism in their paper, but it can be written as
 (5)
(5)
This relation (from Table 5 in Salsi et al. 2021 for F5/K7-II/III spectral class stars) is valid in the range (V − K)0 from 1.8 to 3.9 mag.
The APO-K2 catalogue provides the Ks band magnitude from Two Micron All-Sky Survey and the parallax from Gaia DR3, corrected according to the Gaia zero-point (Lindegren et al. 2021). However, the V band magnitudes it provides are computed starting from magnitudes in the J and Ks bands (Schonhut-Stasik et al. 2024) and have low precision. The APO-K2 catalogue does not provide information about colour excess E(B − V) or extinction in the V band AV either. To obtain both more precise V band magnitudes and E(B − V), we cross-matched the APO-K2 catalogue with the TESS Input Catalogue (TIC) v8.2. The TIC adopts the three-dimensional empirical dust maps from Panoramic Survey Telescope and Rapid Response System (Green et al. 2018), with a re-calibration coefficient of 0.884 applied to obtain E(B − V) values, as prescribed by Schlafly & Finkbeiner (2011). Nevertheless, it is known that the extinction has a negligible effect on the SBCR because the colour and surface brightness are sensitive to it in almost the same way. The only (tiny) difference comes from the extinction in the K band (Nardetto et al. 2020). We adopted the following extinction relations from Cardelli et al. (1989): AV = 3.1 E(B − V) and AK = 0.114 AV. We also verified that the adoption of the relation AK = 0.089 AV from Nishiyama et al. (2009) does not modify the results; it leads to an average variation in the estimated radii of only 0.2%.
Data in the APO-K2 catalogue were subjected to a selection procedure, both to reject apparent outliers and to restrict the data to a metallicity range where asteroseismic scaling relations are the most reliable. Stars satisfying all the following constraints were retained in the sample: [Fe/H] > −1.0 dex, 4000 K < Teff < 5300 K, −0.1 dex < [α/Fe] < 0.4 dex, and log g < 3.25. Stars in the RGB with a mass lower than 0.75 M⊙ were rejected as artefacts because single stars with such a low mass cannot be in the RGB given their long evolutionary timescale. Stars outside the range of colour for the Salsi et al. (2021) SBCR were excluded and so were stars with a binary flag set in the APO-K2 catalogue. Finally, stars with a relative error in the parallax greater than 0.1 were rejected. This allowed us to rely on distances obtained using the inverse parallax (Bailer-Jones et al. 2021; Fouesneau et al. 2023). The final sample comprises 6420 stars, with 4202 of them in the RGB and 2218 in the RC phase.
3. SBCRs to asteroseismic radii comparisons
For all stars in the final sample, linear radii were obtained from Eq. (3), with θ (Eq. (2)) computed using the SBCR from Pietrzyński et al. (2019) and Salsi et al. (2021). This resulted in estimates denoted as Ra and Rb, respectively. The comparison of these radii with R from asteroseismic scaling relations (Fig. 1) revealed both similarities and differences.
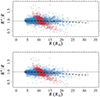 |
Fig. 1. Ratio of the radii from SBCRs and from asteroseismology. Top: Radius ratio using the Pietrzyński et al. (2019) SBCR. Red and blue points correspond to RC and RGB stars, respectively. The dashed black line is a smoother of data, while the dotted one serves as a visual aid. Bottom: Same as in the top panel but using the Salsi et al. (2021) SBCR. |
Overall, there is a notable agreement between the two SBCR methods and the predictions from the scaling relations. The agreement between the SBCR methods and the asteroseismic radius, R, is better for Ra, with an overestimation of the radii by 1.2% over the full sample, while Rb leads to an underestimation by 2.5%. Both SBCRs underestimate radii at higher values, a trend more pronounced for Rb compared to Ra. Interestingly, the analysed SBCRs show the same feature for RC stars because they strongly underestimate radii larger than about 12 R⊙ for RC stars, while the trend for RGB stars is much less pronounced. This difference, which we discuss in detail later, is likely due to differences in the mass and metallicity distribution between the samples of RC and RGB stars. Finally, the dispersion is similar for the two SBCRs, with a standard deviation of 10%.
Figure 2 explores the dependence of radius ratios on various stellar parameters, focusing on the results obtained using the SBCR from Pietrzyński et al. (2019). Similar trends were obtained for the Salsi et al. (2021) SBCR. The impact of the metallicity is investigated in the bottom panel of Figure 2. There is a weak positive trend of Ra/R with metallicity [Fe/H]. This trend is approximately 6% per dex for Ra/R, and it is about 4% per dex for Rb/R.
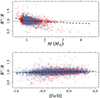 |
Fig. 2. Ratio of the radii from the Pietrzyński et al. (2019) SBCR and from asteroseismology as a function of different stellar parameters. Top: Radius ratio as a function of the stellar mass as estimated by scaling relations. Bottom: Same as in the top panel but as a function of the metallicity [Fe/H]. Colour codes and line styles are as in Fig. 1. |
A significant dependence on asteroseismic mass can be observed in the top panel of Fig. 2. At lower masses, the SBCR method clearly provides a larger radius. However, in the mass range 1.0 to 2.0 M⊙, the average discrepancy is less than 0.1%. The difference at the lower mass end is partially due to the presence of 189 RC stars with masses below 0.75 M⊙, whose SBCR radii are larger than asteroseismic ones by a median of about 6%. Excluding RC stars less massive than 0.75 M⊙, as done for the RGB sample, is however not theoretically justified. In fact, the mass loss, occurring primarily during the later stages of the RGB phase, may significantly impact the stellar mass at the clump phase. For instance, studies of globular clusters suggest that progenitor stars with initial masses of 0.80 M⊙ can lose around 0.17 M⊙ during their evolution (Howell et al. 2022). The internal structure of these objects is dominated by a helium core that is roughly 0.5 M⊙ in size, with minimal variation depending on the star’s initial chemical composition or mass (see e.g. Sweigart & Gross 1978; Cassisi et al. 2016). Asteroseismic observations, which are sensitive to a star’s internal structure, can readily identify these stars, as shown in the top panel of Fig. 3. These low-mass RC stars exhibit a higher Δν value at fixed νmax with respect to more massive objects. However, the presence of these low-mass RC stars alone does not fully explain the discrepancy between SBCRs and asteroseismic radii. This is because even for RGB stars below 0.95 M⊙, Ra/R is overestimated by a median of 4%. This overestimation is likely due to the significant helium core that grows steadily as the stars ascend the RGB. The bottom panel of Fig. 3 demonstrates a clear dependence of the Ra/R ratio on the stellar log g. Stars with lower log g values have a larger helium core, which in turn leads to a greater bias in the Ra/R measurement. A possible reason for the detected discrepancies is the difference in mass range used for calibration. For example, the Gallenne et al. (2018) sample used to calibrate the Pietrzyński et al. (2019) SBCR relation did not include any stars with an estimated mass below 0.9 M⊙. It is, however, interesting that the theoretical investigation performed by Salsi et al. (2022) reports negligible differences between log g = 3 and log g = 0 in the predicted SBCR radii. Therefore the trend detected here might also be due to an inherent bias in the asteroseismic relations.
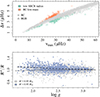 |
Fig. 3. Seismic parameters distribution and dependence on log g for the Ra/R ratio. Top row: Global seismic parameters for the investigated sample. Green symbols identify stars with Ra/R < 0.85. Orange symbols identify RC stars with a mass lower than 0.75 M⊙. Bottom row: Dependence on log g for RGB stars in different mass bins. The dotted and dashed lines are a smoother of the sample with M > 0.95 M⊙ and M < 0.95 M⊙, respectively. |
For higher masses, dominated by RC stars, a more complex and dichotomous trend emerges. Some SBCR radii are estimated close to the asteroseismic ones, while others have significantly lower values. The latter group corresponds to the lower end of the arc-shaped distribution for RC stars in Figure 1. The top panel in Figure 3 shows that objects with Ra/R < 0.85 correspond to the lower end of the Δν − νmax distribution.
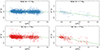 |
Fig. 4. Ratio of the radii from the Pietrzyński et al. (2019) SBCR and asteroseismology as a function of [α/Fe] in different evolutionary phases and mass bins. Top row: Radius ratio for RGB stars. The dashed green lines show the robust regression trends. Bottom row: Same as in the top row but for RC stars. |
The observed dichotomous trend, most prominent for the RC population, arises from the differing responses of SBCR-estimated and asteroseismic radii to variations in [α/Fe] across different mass ranges. Figure 4 shows the Ra/R ratio as a function of [α/Fe] for RGB and RC stars, further subdivided by mass. A cutoff value of 1.7 M⊙ was chosen, but any value up to 2.0 M⊙ yields similar results. Using a higher cutoff would significantly reduce the number of stars in the massive RGB bin. While radius ratios are almost constant in the lower-mass bin, significant trends with [α/Fe] occur for massive stars. To further explore the trends, robust linear models1 were fitted to data. The results are presented in Table 1 and over-plotted in Fig. 4. The trends are similar between RGB and RC stars, with a steeper dependence on [α/Fe] for the more massive RC population. These behaviours suggest a theoretical problem in our understanding of SBCR and asteroseismic radius determinations for α-enhanced massive stars. However, this question cannot be solved with the available data, and further theoretical research is needed to assess the origin of the discrepancy. The evident difference between SBCRs and asteroseismic radii for the RC population in Fig. 1 and the dichotomous trend in Fig. 2 arise from the superposition of the trends in the different mass bins.
Robust regression fits of Ra/R as a function of [α/Fe], according to the evolutionary phase and the stellar mass.
As expected, the agreement between the radii from SBCRs and asteroseismology is significantly better for nearby stars, where parallax measurements are most accurate. Figure 5 demonstrates the noticeable decrease in the dispersion of radius ratios as the parallax increases. The standard deviation of the radius ratios for both SBCRs is halved for stars with a parallax greater than 2.5 mas, reaching 6%. Interestingly, the Salsi et al. (2021) SBCR perfectly agrees with the asteroseismic radii in this range, while the Pietrzyński et al. (2019) method has a positive median overestimation of about 3.0%.
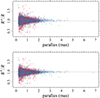 |
Fig. 5. Ratio of the radii from SBCRs and from asteroseismology as a function of the Gaia DR3 parallax. Top: Radius ratio for the Pietrzyński et al. (2019) SBCR. Bottom: Same as in the top panel but for the Salsi et al. (2021) SBCR. Colour codes are as in Fig. 1. |
4. Conclusions
Leveraging the recently released APO-K2 catalogue (Schonhut-Stasik et al. 2024), which contains astrometric, spectroscopic, and asteroseismic information of more than 7500 stars in the RGB and RC evolutionary phases, we performed a comparison of radii derived from asteroseismic scaling relations and those from SBCRs combined with Gaia DR3 parallaxes. We specifically adopted SBCRs from Pietrzyński et al. (2019) and Salsi et al. (2021). Information about colour excess and magnitude in the V band was obtained by cross-matching the APO-K2 catalogue with TIC v8.2. The adopted stellar sample is a couple of orders of magnitude larger than those adopted to investigate the agreement between asteroseismic estimates of stellar radii in binary systems (e.g. Gaulme et al. 2016; Brogaard et al. 2018; Themeßl et al. 2018). The sample encompasses different evolutionary stages, from the early RGB to the RC, and covers a wide metallicity range ([Fe/H] from −1.0 to 0.5 dex). It therefore allowed us to test the agreement between the different radius estimates as a function of various stellar evolutionary characteristics.
Overall, both SBCRs demonstrated good agreement with the asteroseismic estimates. Since asteroseismic scaling relations and SBCRs rely on very different information to obtain their estimates, this agreement is particularly relevant. Comparisons were made using asteroseismic values as a reference, though this choice does not assume them to be unbiased estimators (see Hekker 2020, and references therein for a discussion of the accuracy and precision of asteroseismic radii). The SBCR from Pietrzyński et al. (2019) was found to predict a larger radius with respect to scaling relations by about 1.2% over the whole explored range, while the SBCR from Salsi et al. (2021) was found to be 2.5% smaller than asteroseismic values. Both SBCRs led to radii significantly smaller than the asteroseismic ones when the latter are larger than about 20 R⊙. The two SBCR methods show a similar dispersion of about 10% in the ratio of radii with asteroseismic estimates. The agreement with asteroseismic radii is found to depend strongly on the parallax because the dispersion is halved for stars with a parallax greater than 2.5 mas, where Salsi et al. (2021) estimates proved to be in perfect agreement with asteroseismic ones, while Pietrzyński et al. (2019) radii were overestimated by about 3% with respect to asteroseismic values.
A trend with metallicity [Fe/H] is found, at a level between 4% and 6% per dex. An impact of the metallicity on SBCRs has already been suggested by Kervella et al. (2004) and Boyajian et al. (2012) for main-sequence dwarf stars. For giant stars, a recent theoretical investigation by Salsi et al. (2022), adopting MARCS model atmospheres (Gustafsson et al. 2008) to compute spectra and obtain the surface brightness of stars, found a slight impact of the metallicity, which was almost negligible at the effective temperature of about 5000 K and increased to 10% per dex at lower temperatures, corresponding to V − K ∼ 4. The detected trend of the radius ratios with metallicity is therefore higher than the theoretical prediction of the SBCRs, suggesting a possible bias in the asteroseismic radii.
We found a clear trend with the asteroseismic mass. Stellar radii from SBCRs are significantly larger, by about 6%, than the asteroseismic ones for stars less massive than 0.95 M⊙, while no difference was detected in the 1.0 to 2.0 M⊙ mass range. This overestimation is correlated with the presence of a significant extension of the helium core with respect to the envelope in the stellar structures. The most interesting result of the present investigation is that the radius ratio trends with asteroseismic mass show a dichotomous behaviour moving to high mass values, mainly due to the presence of several RC stars with SBCR radii significantly lower with respect to asteroseismology. Analysis of this behaviour allowed us to highlight a different response of the asteroseismic scaling relations and SBCRs to [α/Fe] for massive stars, in both the RGB and RC phases, which is reported here for the first time. In fact, theoretical investigation by Salsi et al. (2022) did not detect any impact of the mass on their synthetic SBCR, but the tested mass range did not comprise low-mass stars, extending from 2.0 to 5.0 M⊙. Moreover no investigation was performed to assess the influence, if any, of α enhancement. Further investigations are encouraged in order to understand these trends because they suggest a theoretical problem in the SBCR and/or asteroseismic radius estimates.
The strong agreement between radii determined by SBCRs and asteroseismology, particularly for RGB stars, is highly encouraging. These two methods differ fundamentally, not only in the observables they rely on but also in terms of observation time, instrumentation requirements, and budget constraints. In all of these aspects, SBCRs offer significant advantages, opening the possibility for obtaining large samples of asteroseismic-compatible radius estimates with minimal financial investment.
Robust linear models are an alternative to least-squares regression when the assumptions about the error distribution are violated. These models can downplay the influence of outliers and provide more accurate estimates in the presence of non-normal errors. Further details can be found, for example, in Venables & Ripley (2002) and Feigelson & Babu (2012).
Acknowledgments
G.V., P.G.P.M. and S.D. acknowledge INFN (Iniziativa specifica TAsP) and support from PRIN MIUR2022 Progetto “CHRONOS” (PI: S. Cassisi) finanziato dall’Unione Europea – Next Generation EU.
References
- Abdurro’uf, Accetta, K., Aerts, C., et al. 2022, ApJS, 259, 35 [NASA ADS] [CrossRef] [Google Scholar]
- Andersen, J., Clausen, J. V., Nordstrom, B., Tomkin, J., & Mayor, M. 1991, A&A, 246, 99 [NASA ADS] [Google Scholar]
- Bailer-Jones, C. A. L., Rybizki, J., Fouesneau, M., Demleitner, M., & Andrae, R. 2021, AJ, 161, 147 [Google Scholar]
- Baines, E. K., Döllinger, M. P., Cusano, F., et al. 2010, ApJ, 710, 1365 [NASA ADS] [CrossRef] [Google Scholar]
- Borucki, W. J., Koch, D., Basri, G., et al. 2010, Science, 327, 977 [Google Scholar]
- Boyajian, T. S., von Braun, K., van Belle, G., et al. 2012, ApJ, 757, 112 [Google Scholar]
- Branco, V., Coelho, P. R. T., Lançon, A., Martins, L. P., & Prugniel, P. 2024, A&A, 687, A142 [NASA ADS] [CrossRef] [EDP Sciences] [Google Scholar]
- Brogaard, K., Hansen, C. J., Miglio, A., et al. 2018, MNRAS, 476, 3729 [Google Scholar]
- Buldgen, G., Rendle, B., Sonoi, T., et al. 2019, MNRAS, 482, 2305 [Google Scholar]
- Cardelli, J. A., Clayton, G. C., & Mathis, J. S. 1989, ApJ, 345, 245 [Google Scholar]
- Cassisi, S., Salaris, M., & Pietrinferni, A. 2016, A&A, 585, A124 [NASA ADS] [CrossRef] [EDP Sciences] [Google Scholar]
- Claret, A., & Torres, G. 2017, ApJ, 849, 18 [Google Scholar]
- Coelho, P. R. T. 2014, MNRAS, 440, 1027 [Google Scholar]
- Di Benedetto, G. P. 2005, MNRAS, 357, 174 [NASA ADS] [CrossRef] [Google Scholar]
- Epstein, C. R., Elsworth, Y. P., Johnson, J. A., et al. 2014, ApJ, 785, L28 [Google Scholar]
- Feigelson, E. D., & Babu, G. J. 2012, Modern Statistical Methods for Astronomy with R Applications (Cambridge: Cambridge University Press) [CrossRef] [Google Scholar]
- Fouesneau, M., Frémat, Y., Andrae, R., et al. 2023, A&A, 674, A28 [NASA ADS] [CrossRef] [EDP Sciences] [Google Scholar]
- Gaia Collaboration (Brown, A. G. A., et al.) 2021, A&A, 649, A1 [NASA ADS] [CrossRef] [EDP Sciences] [Google Scholar]
- Gallenne, A., Kervella, P., Mérand, A., et al. 2012, A&A, 541, A87 [NASA ADS] [CrossRef] [EDP Sciences] [Google Scholar]
- Gallenne, A., Pietrzyński, G., Graczyk, D., et al. 2018, A&A, 616, A68 [NASA ADS] [CrossRef] [EDP Sciences] [Google Scholar]
- Gaulme, P., McKeever, J., Jackiewicz, J., et al. 2016, ApJ, 832, 121 [NASA ADS] [CrossRef] [Google Scholar]
- Green, G. M., Schlafly, E. F., Finkbeiner, D., et al. 2018, MNRAS, 478, 651 [Google Scholar]
- Gustafsson, B., Edvardsson, B., Eriksson, K., et al. 2008, A&A, 486, 951 [NASA ADS] [CrossRef] [EDP Sciences] [Google Scholar]
- Hegedűs, V., Mészáros, S., Jofré, P., et al. 2023, A&A, 670, A107 [NASA ADS] [CrossRef] [EDP Sciences] [Google Scholar]
- Hekker, S. 2020, Front. Astron. Space Sci., 7, 3 [NASA ADS] [CrossRef] [Google Scholar]
- Howell, M., Campbell, S. W., Stello, D., & De Silva, G. M. 2022, MNRAS, 515, 3184 [NASA ADS] [CrossRef] [Google Scholar]
- Ivanyuk, O. M., Jenkins, J. S., Pavlenko, Y. V., Jones, H. R. A., & Pinfield, D. J. 2017, MNRAS, 468, 4151 [Google Scholar]
- Kervella, P., Thévenin, F., Di Folco, E., & Ségransan, D. 2004, A&A, 426, 297 [NASA ADS] [CrossRef] [EDP Sciences] [Google Scholar]
- Kjeldsen, H., & Bedding, T. R. 1995, A&A, 293, 87 [NASA ADS] [Google Scholar]
- Lachaume, R., Rabus, M., Jordán, A., et al. 2019, MNRAS, 484, 2656 [NASA ADS] [CrossRef] [Google Scholar]
- Lindegren, L., Bastian, U., Biermann, M., et al. 2021, A&A, 649, A4 [EDP Sciences] [Google Scholar]
- Martig, M., Rix, H.-W., Silva Aguirre, V., et al. 2015, MNRAS, 451, 2230 [NASA ADS] [CrossRef] [Google Scholar]
- Mozurkewich, D., Armstrong, J. T., Hindsley, R. B., et al. 2003, AJ, 126, 2502 [NASA ADS] [CrossRef] [Google Scholar]
- Nardetto, N., Salsi, A., Mourard, D., et al. 2020, A&A, 639, A67 [NASA ADS] [CrossRef] [EDP Sciences] [Google Scholar]
- Nardetto, N., Gieren, W., Storm, J., et al. 2023, A&A, 671, A14 [NASA ADS] [CrossRef] [EDP Sciences] [Google Scholar]
- Nishiyama, S., Tamura, M., Hatano, H., et al. 2009, ApJ, 696, 1407 [NASA ADS] [CrossRef] [Google Scholar]
- Nordgren, T. E., Germain, M. E., Benson, J. A., et al. 1999, AJ, 118, 3032 [NASA ADS] [CrossRef] [Google Scholar]
- Perraut, K., Cunha, M., Romanovskaya, A., et al. 2020, A&A, 642, A101 [NASA ADS] [CrossRef] [EDP Sciences] [Google Scholar]
- Pietrzyński, G., Graczyk, D., Gallenne, A., et al. 2019, Nature, 567, 200 [Google Scholar]
- Pinsonneault, M. H., Elsworth, Y., Epstein, C., et al. 2014, ApJS, 215, 19 [Google Scholar]
- Ricker, G. R., Winn, J. N., Vanderspek, R., et al. 2015, J. Astron. Telesc. Instrum. Syst., 1, 014003 [Google Scholar]
- Salsi, A., Nardetto, N., Mourard, D., et al. 2021, A&A, 652, A26 [NASA ADS] [CrossRef] [EDP Sciences] [Google Scholar]
- Salsi, A., Nardetto, N., Plez, B., & Mourard, D. 2022, A&A, 662, A120 [NASA ADS] [CrossRef] [EDP Sciences] [Google Scholar]
- Schlafly, E. F., & Finkbeiner, D. P. 2011, ApJ, 737, 103 [Google Scholar]
- Schonhut-Stasik, J., Zinn, J. C., Stassun, K. G., et al. 2024, AJ, 167, 50 [NASA ADS] [CrossRef] [Google Scholar]
- Stello, D., & Sharma, S. 2022, Res. Notes Am. Astron. Soc., 6, 168 [Google Scholar]
- Stello, D., Huber, D., Sharma, S., et al. 2015, ApJ, 809, L3 [NASA ADS] [CrossRef] [Google Scholar]
- Sweigart, A. V., & Gross, P. G. 1978, ApJS, 36, 405 [NASA ADS] [CrossRef] [Google Scholar]
- Themeßl, N., Hekker, S., Southworth, J., et al. 2018, MNRAS, 478, 4669 [Google Scholar]
- Thomsen, J. S., Brogaard, K., Arentoft, T., et al. 2022, MNRAS, 517, 4187 [NASA ADS] [CrossRef] [Google Scholar]
- Torres, G., Andersen, J., & Giménez, A. 2010, A&ARv, 18, 67 [Google Scholar]
- Torres, G., Clausen, J. V., Bruntt, H., et al. 2012, A&A, 537, A117 [EDP Sciences] [Google Scholar]
- Ulrich, R. K. 1986, ApJ, 306, L37 [Google Scholar]
- Valentini, M., Chiappini, C., Bossini, D., et al. 2019, A&A, 627, A173 [NASA ADS] [CrossRef] [EDP Sciences] [Google Scholar]
- Valle, G., Dell’Omodarme, M., Prada Moroni, P. G., & Degl’Innocenti, S. 2017, A&A, 600, A41 [NASA ADS] [CrossRef] [EDP Sciences] [Google Scholar]
- Valle, G., Dell’Omodarme, M., Prada Moroni, P. G., & Degl’Innocenti, S. 2023, A&A, 678, A203 [NASA ADS] [CrossRef] [EDP Sciences] [Google Scholar]
- Valle, G., Dell’Omodarme, M., Prada Moroni, P. G., & Degl’Innocenti, S. 2024, A&A, 685, A150 [NASA ADS] [CrossRef] [EDP Sciences] [Google Scholar]
- Venables, W., & Ripley, B. 2002, Modern Applied Statistics with S, Statistics and Computing (Springer) [CrossRef] [Google Scholar]
- Viani, L. S., Basu, S., Chaplin, W. J., Davies, G. R., & Elsworth, Y. 2017, ApJ, 843, 11 [NASA ADS] [CrossRef] [Google Scholar]
- Yu, J., Khanna, S., Themessl, N., et al. 2023, ApJS, 264, 41 [NASA ADS] [CrossRef] [Google Scholar]
- Zinn, J. C., Stello, D., Elsworth, Y., et al. 2022, ApJ, 926, 191 [NASA ADS] [CrossRef] [Google Scholar]
All Tables
Robust regression fits of Ra/R as a function of [α/Fe], according to the evolutionary phase and the stellar mass.
All Figures
|
Fig. 1. Ratio of the radii from SBCRs and from asteroseismology. Top: Radius ratio using the Pietrzyński et al. (2019) SBCR. Red and blue points correspond to RC and RGB stars, respectively. The dashed black line is a smoother of data, while the dotted one serves as a visual aid. Bottom: Same as in the top panel but using the Salsi et al. (2021) SBCR. |
| In the text | |
|
Fig. 2. Ratio of the radii from the Pietrzyński et al. (2019) SBCR and from asteroseismology as a function of different stellar parameters. Top: Radius ratio as a function of the stellar mass as estimated by scaling relations. Bottom: Same as in the top panel but as a function of the metallicity [Fe/H]. Colour codes and line styles are as in Fig. 1. |
| In the text | |
|
Fig. 3. Seismic parameters distribution and dependence on log g for the Ra/R ratio. Top row: Global seismic parameters for the investigated sample. Green symbols identify stars with Ra/R < 0.85. Orange symbols identify RC stars with a mass lower than 0.75 M⊙. Bottom row: Dependence on log g for RGB stars in different mass bins. The dotted and dashed lines are a smoother of the sample with M > 0.95 M⊙ and M < 0.95 M⊙, respectively. |
| In the text | |
|
Fig. 4. Ratio of the radii from the Pietrzyński et al. (2019) SBCR and asteroseismology as a function of [α/Fe] in different evolutionary phases and mass bins. Top row: Radius ratio for RGB stars. The dashed green lines show the robust regression trends. Bottom row: Same as in the top row but for RC stars. |
| In the text | |
|
Fig. 5. Ratio of the radii from SBCRs and from asteroseismology as a function of the Gaia DR3 parallax. Top: Radius ratio for the Pietrzyński et al. (2019) SBCR. Bottom: Same as in the top panel but for the Salsi et al. (2021) SBCR. Colour codes are as in Fig. 1. |
| In the text | |
Current usage metrics show cumulative count of Article Views (full-text article views including HTML views, PDF and ePub downloads, according to the available data) and Abstracts Views on Vision4Press platform.
Data correspond to usage on the plateform after 2015. The current usage metrics is available 48-96 hours after online publication and is updated daily on week days.
Initial download of the metrics may take a while.