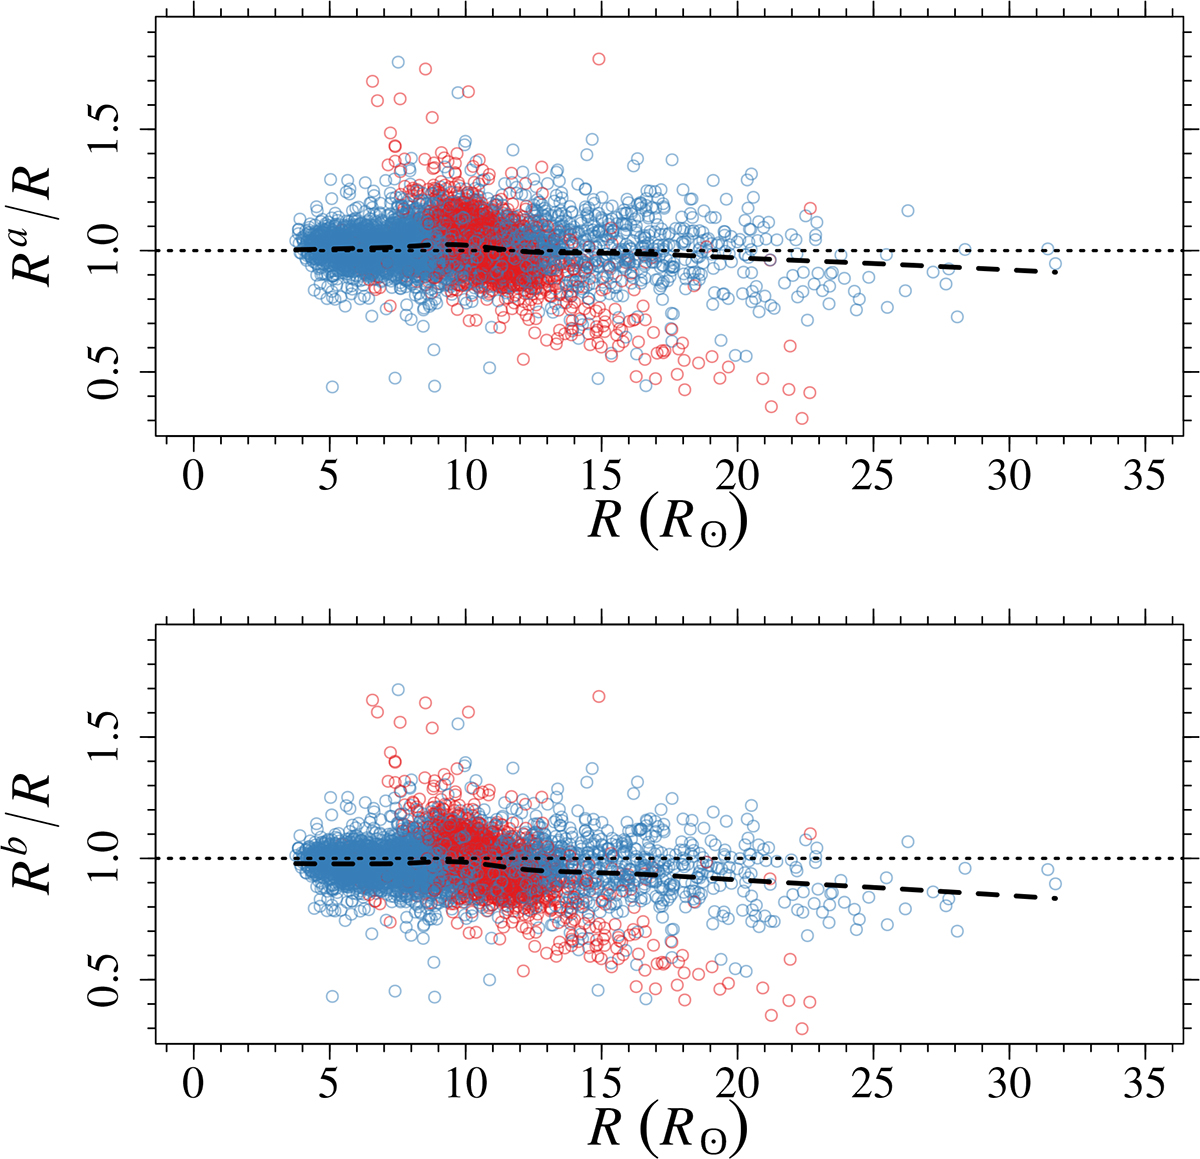
Fig. 1.
Download original image
Ratio of the radii from SBCRs and from asteroseismology. Top: Radius ratio using the Pietrzyński et al. (2019) SBCR. Red and blue points correspond to RC and RGB stars, respectively. The dashed black line is a smoother of data, while the dotted one serves as a visual aid. Bottom: Same as in the top panel but using the Salsi et al. (2021) SBCR.
Current usage metrics show cumulative count of Article Views (full-text article views including HTML views, PDF and ePub downloads, according to the available data) and Abstracts Views on Vision4Press platform.
Data correspond to usage on the plateform after 2015. The current usage metrics is available 48-96 hours after online publication and is updated daily on week days.
Initial download of the metrics may take a while.