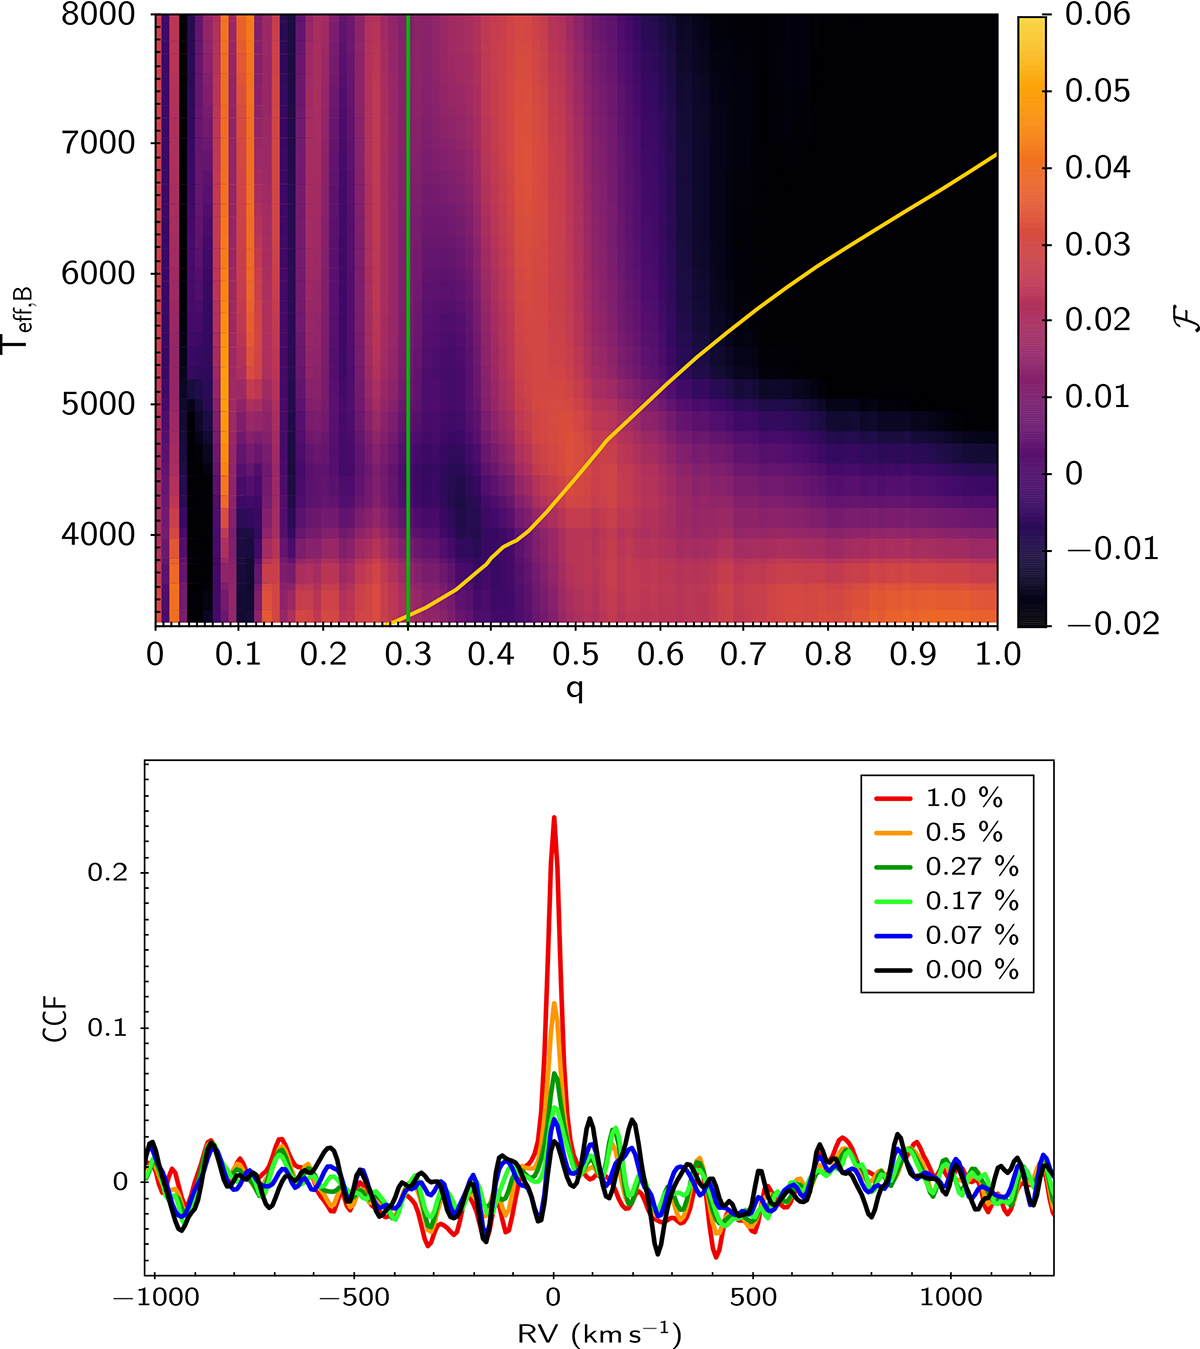
Fig. 4.
Download original image
Detection plots for star W57. Top: SSF in the q − Teff plane. The vertical green line marks the lower limit of q according to the spectroscopic mass function and an estimated primary mass of 1.4 M⊙. The yellow line shows the temperature for each possible value of the secondary mass, assuming it is a main-sequence star of the age of the cluster. Bottom: Cross-correlation function of the reconstructed secondary spectrum for several experiments adding artificial secondaries to the observed spectra. The inset shows the contribution of the secondary star to the total flux.
Current usage metrics show cumulative count of Article Views (full-text article views including HTML views, PDF and ePub downloads, according to the available data) and Abstracts Views on Vision4Press platform.
Data correspond to usage on the plateform after 2015. The current usage metrics is available 48-96 hours after online publication and is updated daily on week days.
Initial download of the metrics may take a while.