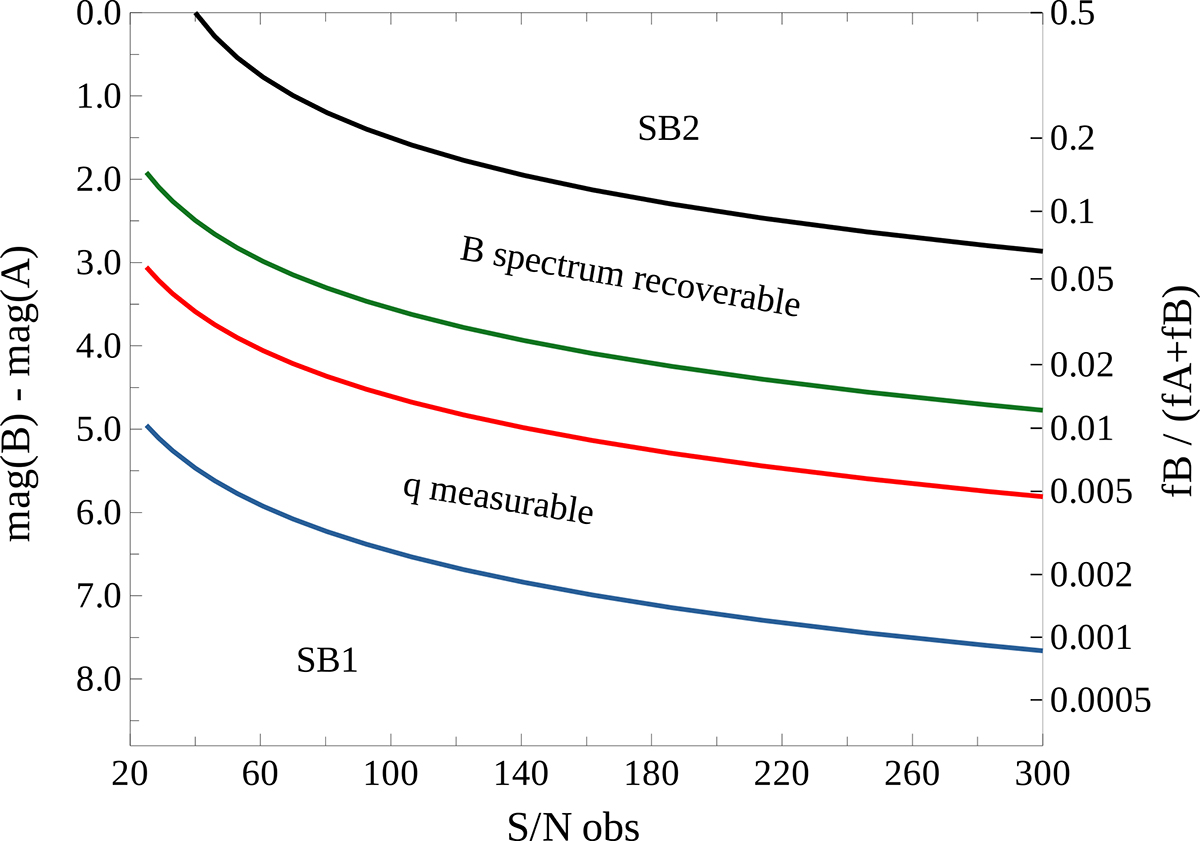
Fig. 3.
Download original image
Frontier between SB1s and SB2s. In the upper region (labeled SB2), the spectral lines of the secondary are visible in individual spectra. Between the black and the green curves, the spectral lines of the secondary are not distinguishable in individual spectra but they are clearly seen in the reconstructed spectrum of the secondary, in which the S/N is increased by a factor equal to the square root of the number of observations. Above the red line, the peak of the cross-correlation function is high enough to measure RV in individual spectra. The region labeled with “q measurable” corresponds to configurations in which it is not possible to measure RVs for the secondary star nor to study the spectral morphology of the spectrum, but still it is possible with our technique to calculate the mass ratio.
Current usage metrics show cumulative count of Article Views (full-text article views including HTML views, PDF and ePub downloads, according to the available data) and Abstracts Views on Vision4Press platform.
Data correspond to usage on the plateform after 2015. The current usage metrics is available 48-96 hours after online publication and is updated daily on week days.
Initial download of the metrics may take a while.