Fig. 2.
Download original image
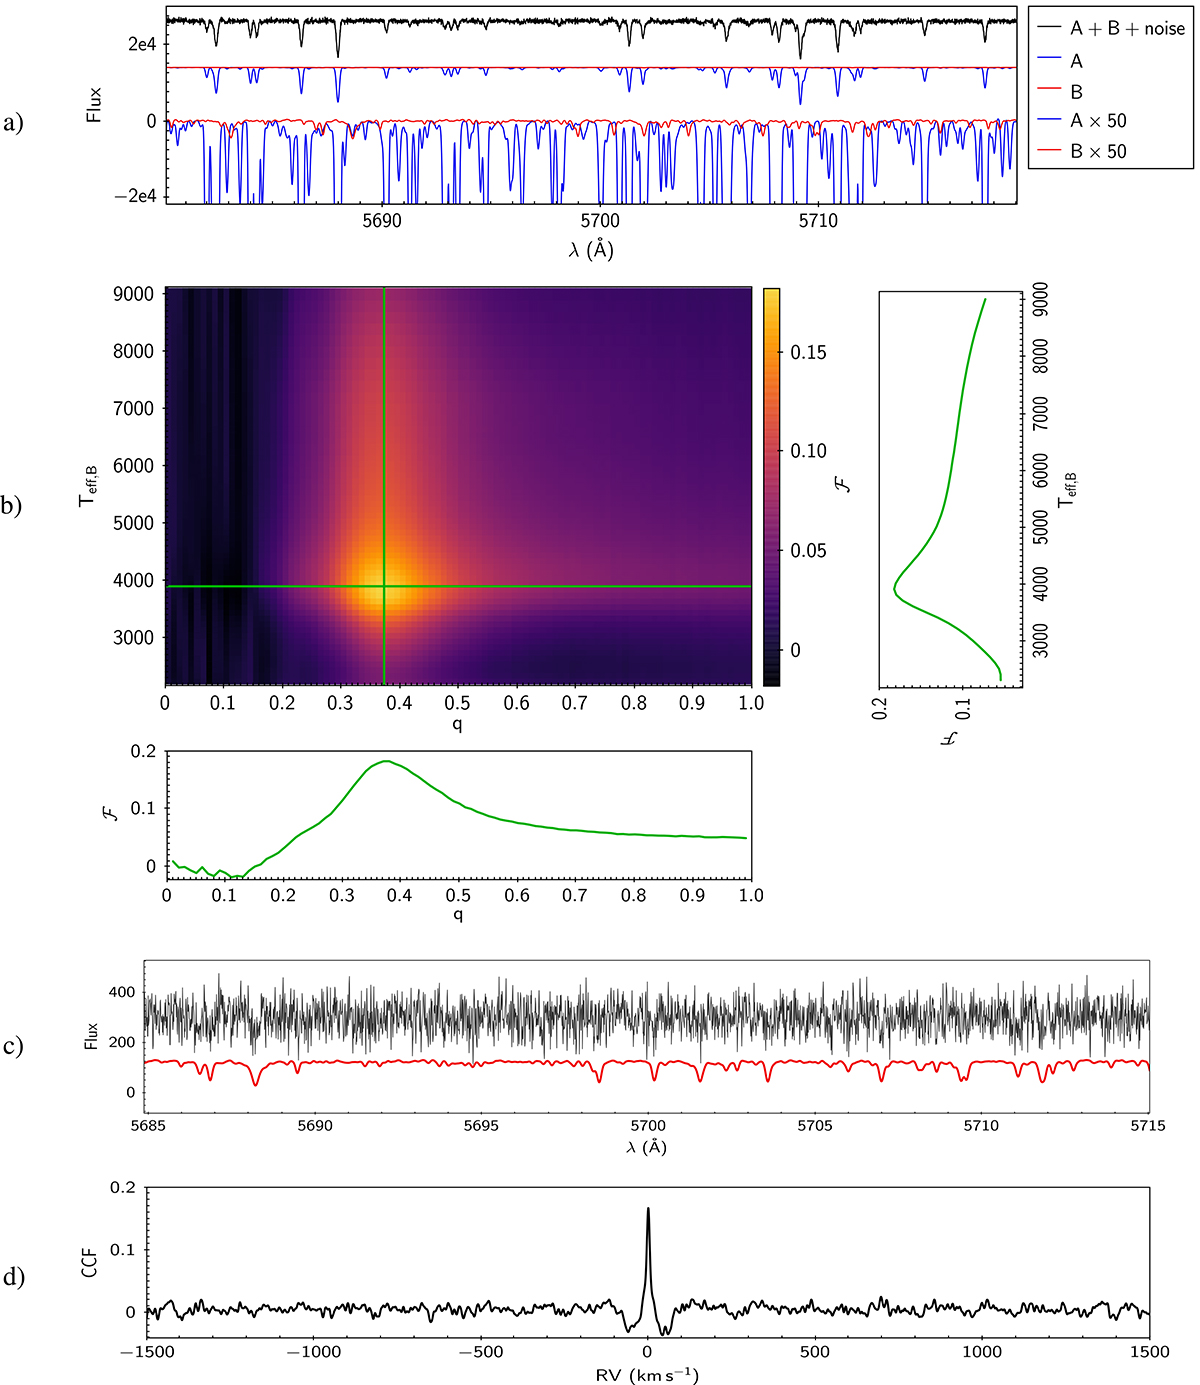
Detection plots for the secondary companion in a synthetic example. a) One of the 20 artificial binary spectra of the demonstration example. The “observed” composite spectrum (black) is compared with component synthetic spectra (primary in blue, secondary in red) to show the intensity of the secondary lines. The lower spectra have been multiplied by 50 for better visibility. Arbitrary vertical shifts have been applied. b) SSF in the q − Teff plane. Green lines mark the position of the maximum and next to both axes the corresponding cross-sections defining the best solution (Teff = 4000 K, q = 0.37) are shown. c) Reconstructed secondary spectrum (black) compared with a synthetic noise-free spectrum of 4000 K (red). d) Cross-correlation function corresponding to the adopted solution.
Current usage metrics show cumulative count of Article Views (full-text article views including HTML views, PDF and ePub downloads, according to the available data) and Abstracts Views on Vision4Press platform.
Data correspond to usage on the plateform after 2015. The current usage metrics is available 48-96 hours after online publication and is updated daily on week days.
Initial download of the metrics may take a while.