Open Access
Fig. 11.
Download original image
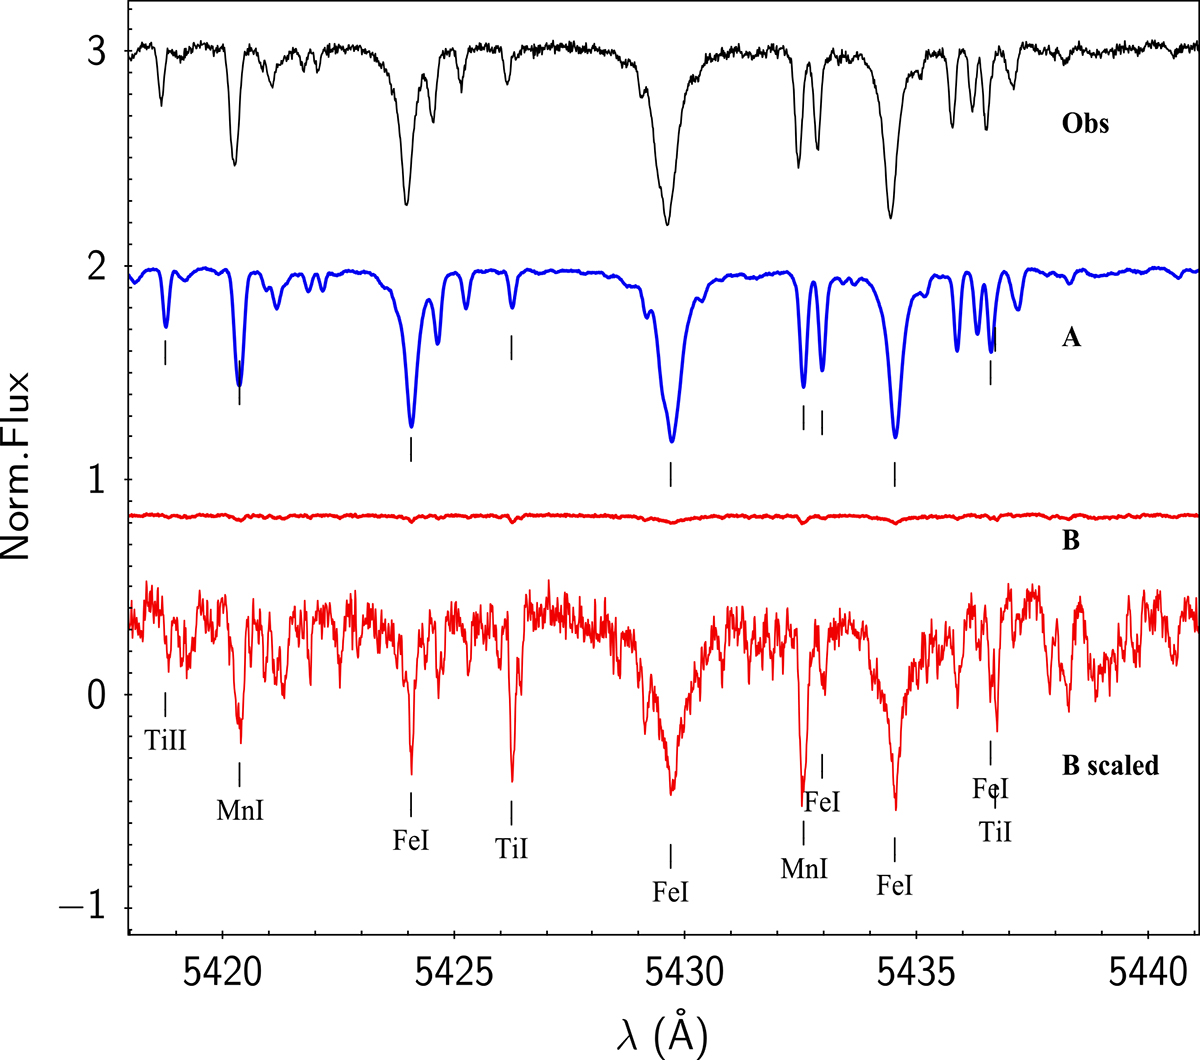
Disentangled spectra of the components of PX Vir. From top to bottom: One of the observed spectra (black), the reconstructed spectrum of the primary (blue), the spectrum of the secondary (red), and the secondary spectrum multiplied by 23. Arbitrary vertical shifts have been applied for better visibility.
Current usage metrics show cumulative count of Article Views (full-text article views including HTML views, PDF and ePub downloads, according to the available data) and Abstracts Views on Vision4Press platform.
Data correspond to usage on the plateform after 2015. The current usage metrics is available 48-96 hours after online publication and is updated daily on week days.
Initial download of the metrics may take a while.