Fig. 4.
Download original image
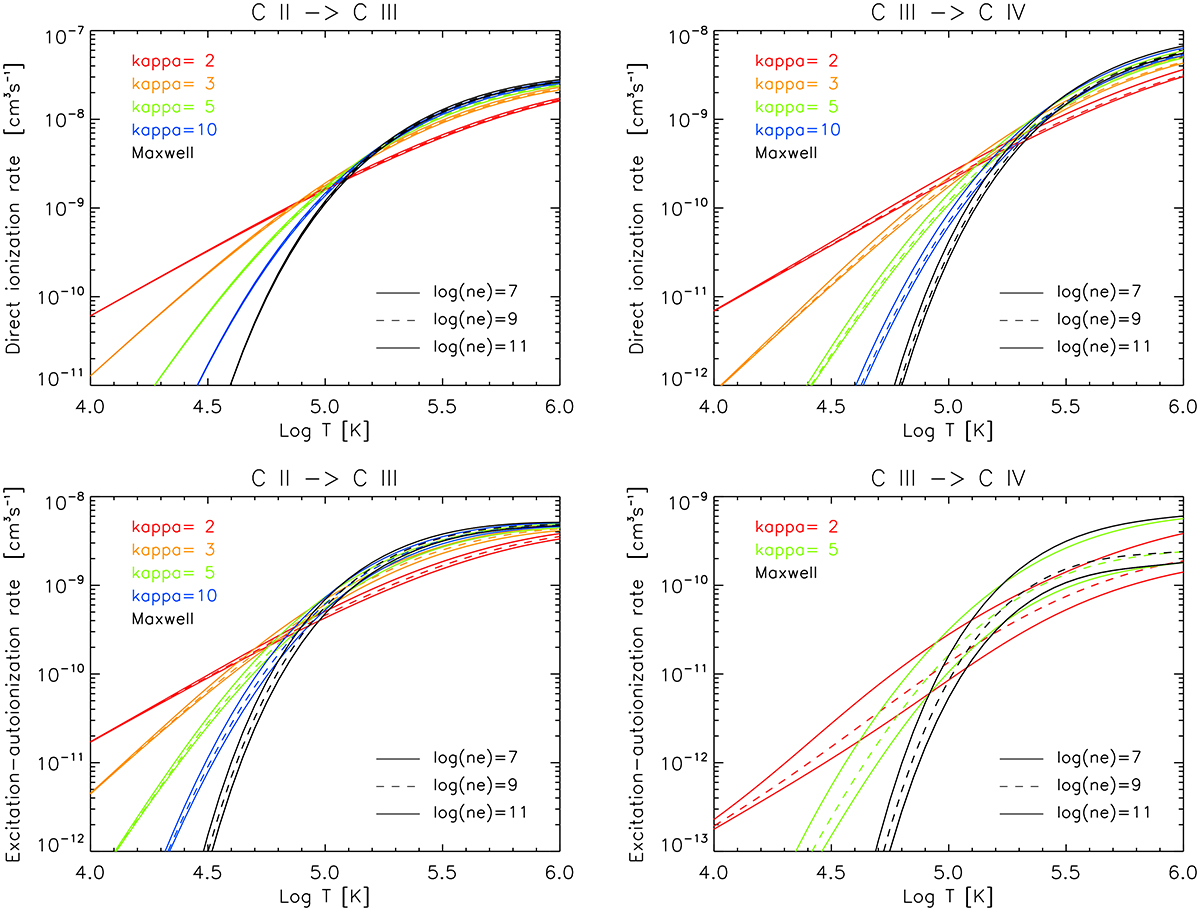
Dependence of the direct ionization (top panels) and excitation-autoionization rates (bottom panels) from C II → C III (left) and C III → C IV (right) at three different electron densities, log(ne [cm−3]) = 7, 9, and 11. The different colours correspond to different distributions, as indicated. The bottom right panel only shows the autoionization rate for κ = 2, 5, and Maxwellian for increased clarity (κ = 3 and 10 are omitted).
Current usage metrics show cumulative count of Article Views (full-text article views including HTML views, PDF and ePub downloads, according to the available data) and Abstracts Views on Vision4Press platform.
Data correspond to usage on the plateform after 2015. The current usage metrics is available 48-96 hours after online publication and is updated daily on week days.
Initial download of the metrics may take a while.