Fig. 2
Download original image
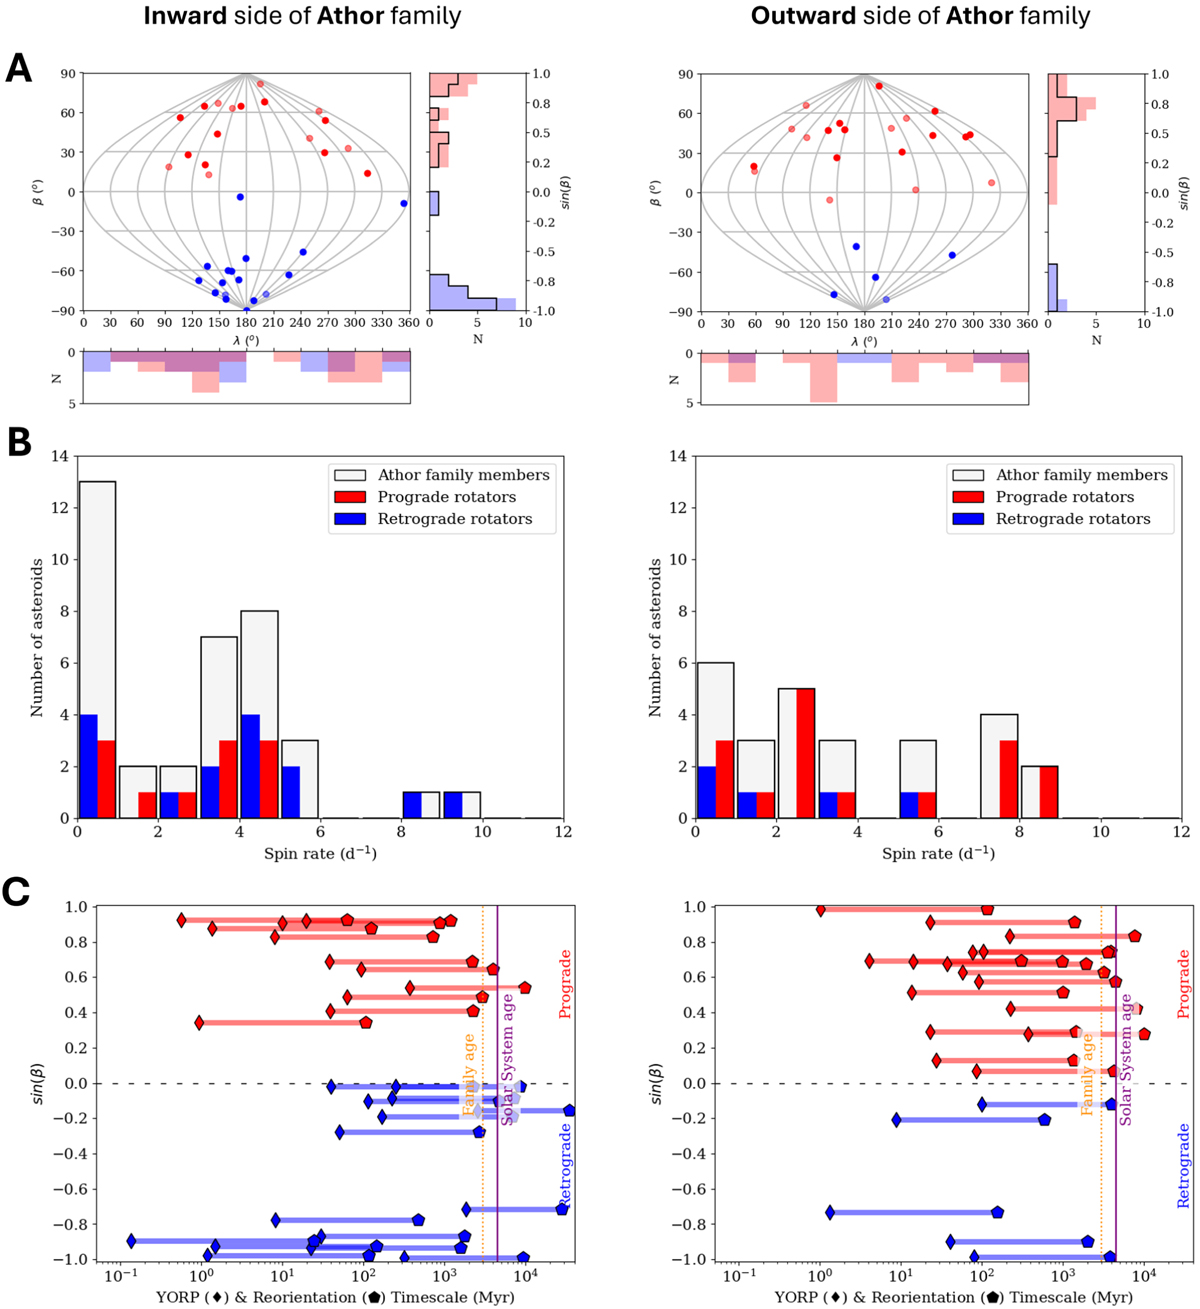
Spin pole distribution and rotational characteristics of Athor family members. Panel A: distribution of the complete spin pole solutions for the Athor family members located on the inward and outward sides separately. The main plot of each panel is a sinusoidal equal-area cartographic representation, where the vertical grey lines define the longitude (λ) and the horizontal curves define the latitude (β) of the spin pole solutions. The faintest markers correspond to halo members. The histograms to the right of the main plots represent the latitude (β) of prograde (red) and retrograde (blue) rotators; the black line corresponds only to the core members. The histograms below the main plots represent the longitude (λ) of prograde (red) and retrograde (blue) rotators. The specific λ and β values for each asteroid are given in Tables E.1 and E.2. Panel B: histogram of spin rate for members of the Athor asteroid family for each side of the V-shape. The prograde rotators are in red and the retrograde in blue. The light grey bars represent the primordial family members whose rotational period is known either from this study or the literature. Panel C: yORP and reorientation timescales along with the pole latitude solutions for Athor family members in the inward and the outward side. The YORP timescale is presented as thin diamond markers and reorientation as pentagon markers. A solid line connects these two timescales of the same object.
Current usage metrics show cumulative count of Article Views (full-text article views including HTML views, PDF and ePub downloads, according to the available data) and Abstracts Views on Vision4Press platform.
Data correspond to usage on the plateform after 2015. The current usage metrics is available 48-96 hours after online publication and is updated daily on week days.
Initial download of the metrics may take a while.