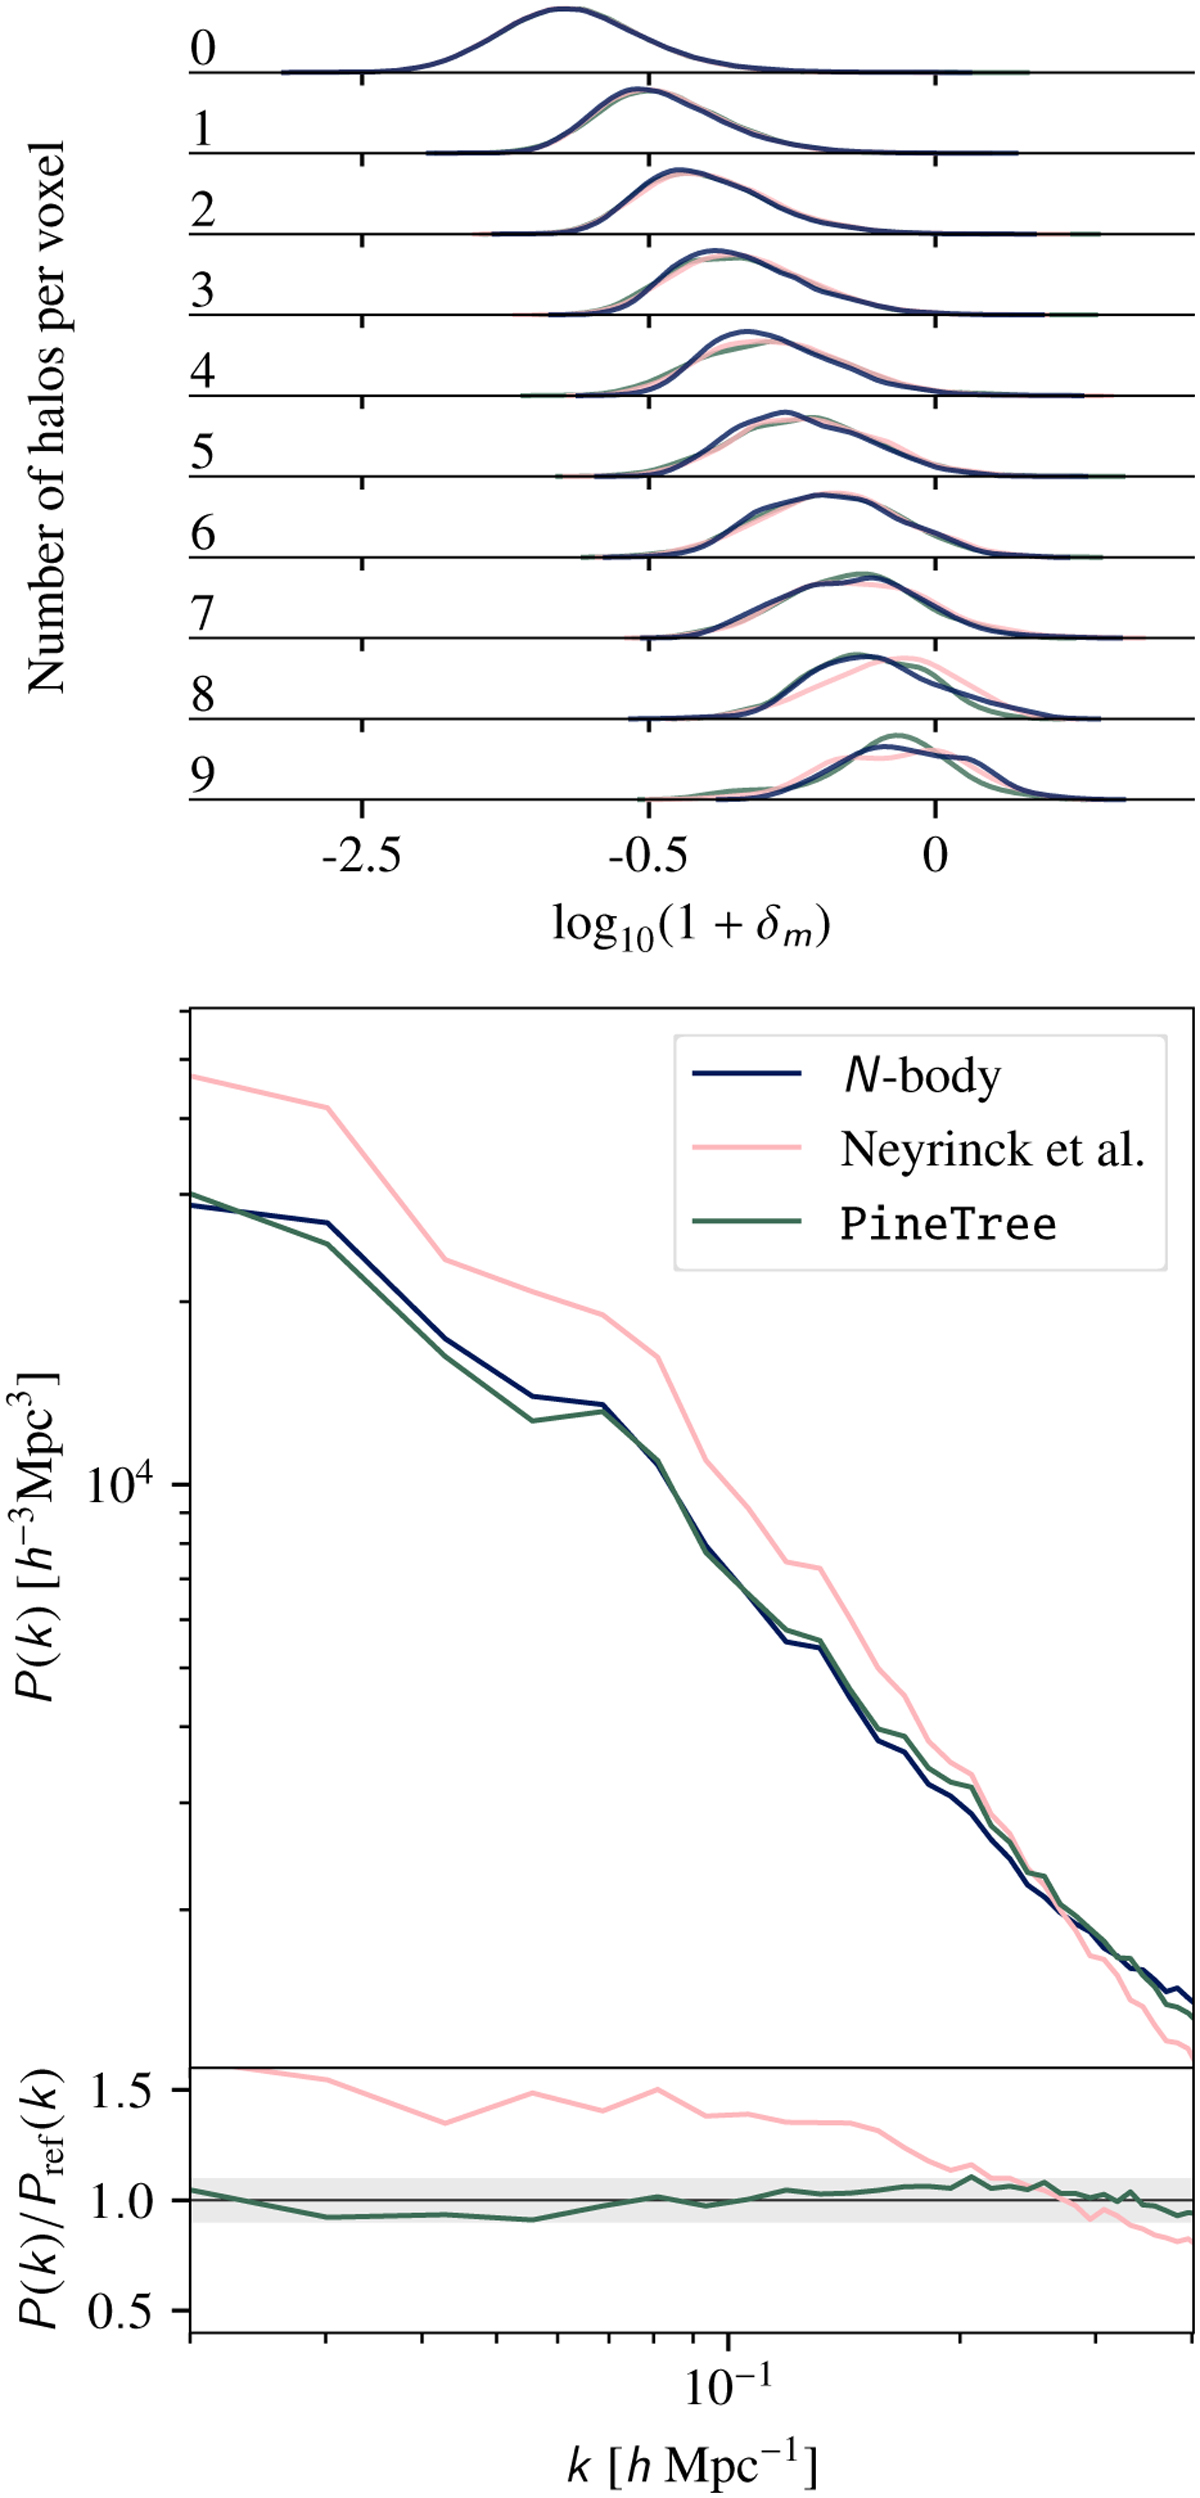
Fig. 1
Download original image
Comparison between using one-point statistics (upper panel) and two-point statistics (lower panel) as validation metrics. The first panel on top shows a kernel density estimate plot of the number of voxels with a given halo count as a function of the underlying DM overdensity. Each line corresponds to the number of halos per voxel, as is indicated by the annotated text on the left. The distributions were produced using a Gaussian kernel with a bandwidth set according to Scott’s rule (Scott 2015). The dark blue, pink, and green curves show the number distribution obtained from N-body simulation, the TPL by Neyrinck et al. (2014), and PineTree respectively. In the bottom panel, we show the mean power spectrum from the generated fields and ratios with respect to the reference N-body simulation. The grey band indicates the 10% deviation threshold.
Current usage metrics show cumulative count of Article Views (full-text article views including HTML views, PDF and ePub downloads, according to the available data) and Abstracts Views on Vision4Press platform.
Data correspond to usage on the plateform after 2015. The current usage metrics is available 48-96 hours after online publication and is updated daily on week days.
Initial download of the metrics may take a while.