Fig. 9
Download original image
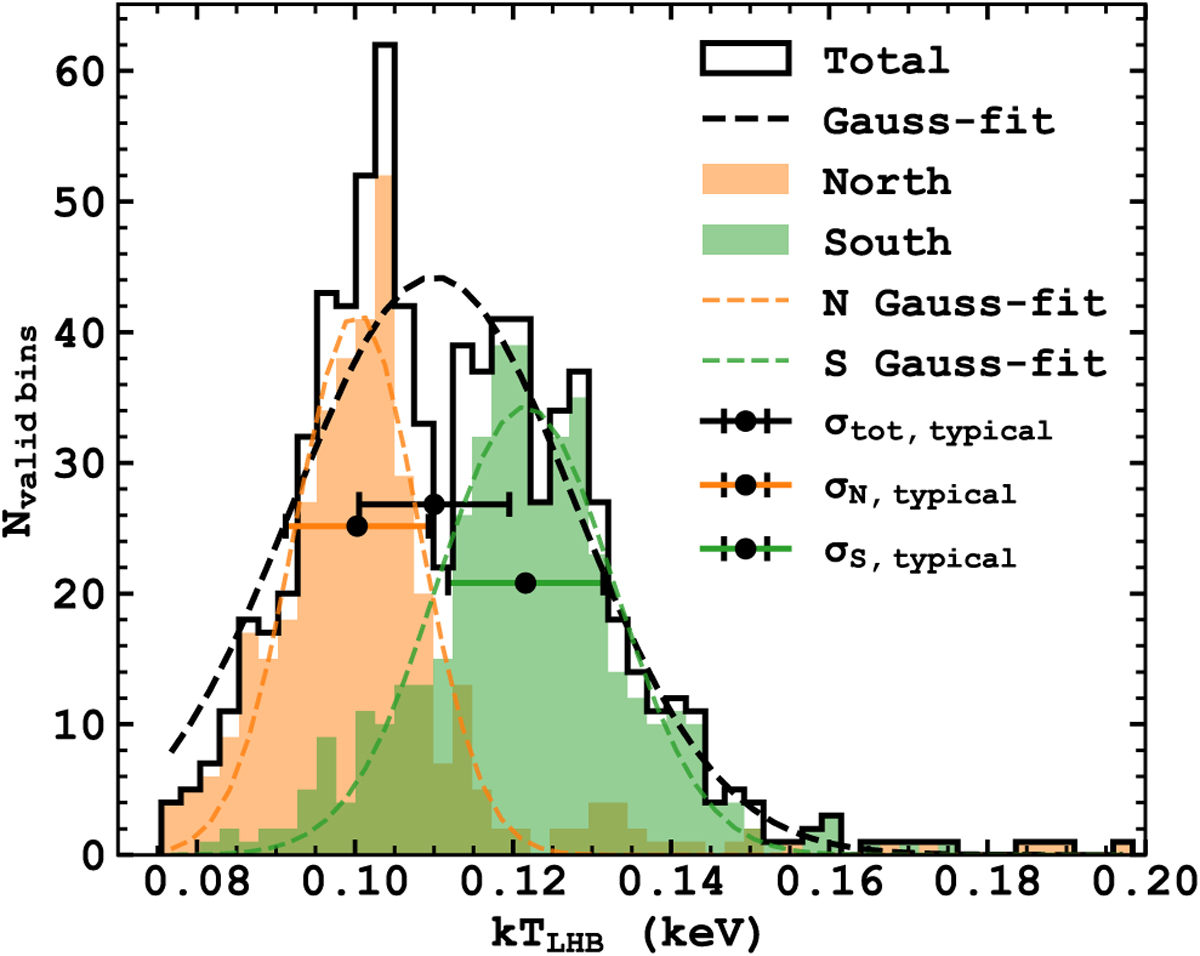
Distribution of kTLHB in the high latitude regions (|b| > 30°). The unfilled histogram outlined in black displays the distribution of all the high latitude bins displayed in Fig. 8. The black dashed line shows the Gaussian best fit for the distribution. The black data point with error bars shows the typical (median) 1σ spectral fitting uncertainty, centred at the mean of the fitted Gaussian. It is plotted at a height of exp (−1/2)Ngauss,peak = 0.606 Ngauss,peak for proper comparison between the spectral fitting uncertainty and the width of the distribution. The former (0.010 keV) is approximately half of the latter (0.018 keV), demonstrating a genuine variation in the LHB temperature. The sample is divided into the northern (orange) and the southern (green) Galactic hemispheres to demonstrate the primary source of variation is a large-scale gradient instead of small-scale fluctuations. The northern hemisphere is cooler (0.100 keV) than the south (0.122 keV), and comparing their distributions with the respective typical spectral fitting uncertainties shows that each hemisphere exhibits approximately constant LHB temperature.
Current usage metrics show cumulative count of Article Views (full-text article views including HTML views, PDF and ePub downloads, according to the available data) and Abstracts Views on Vision4Press platform.
Data correspond to usage on the plateform after 2015. The current usage metrics is available 48-96 hours after online publication and is updated daily on week days.
Initial download of the metrics may take a while.