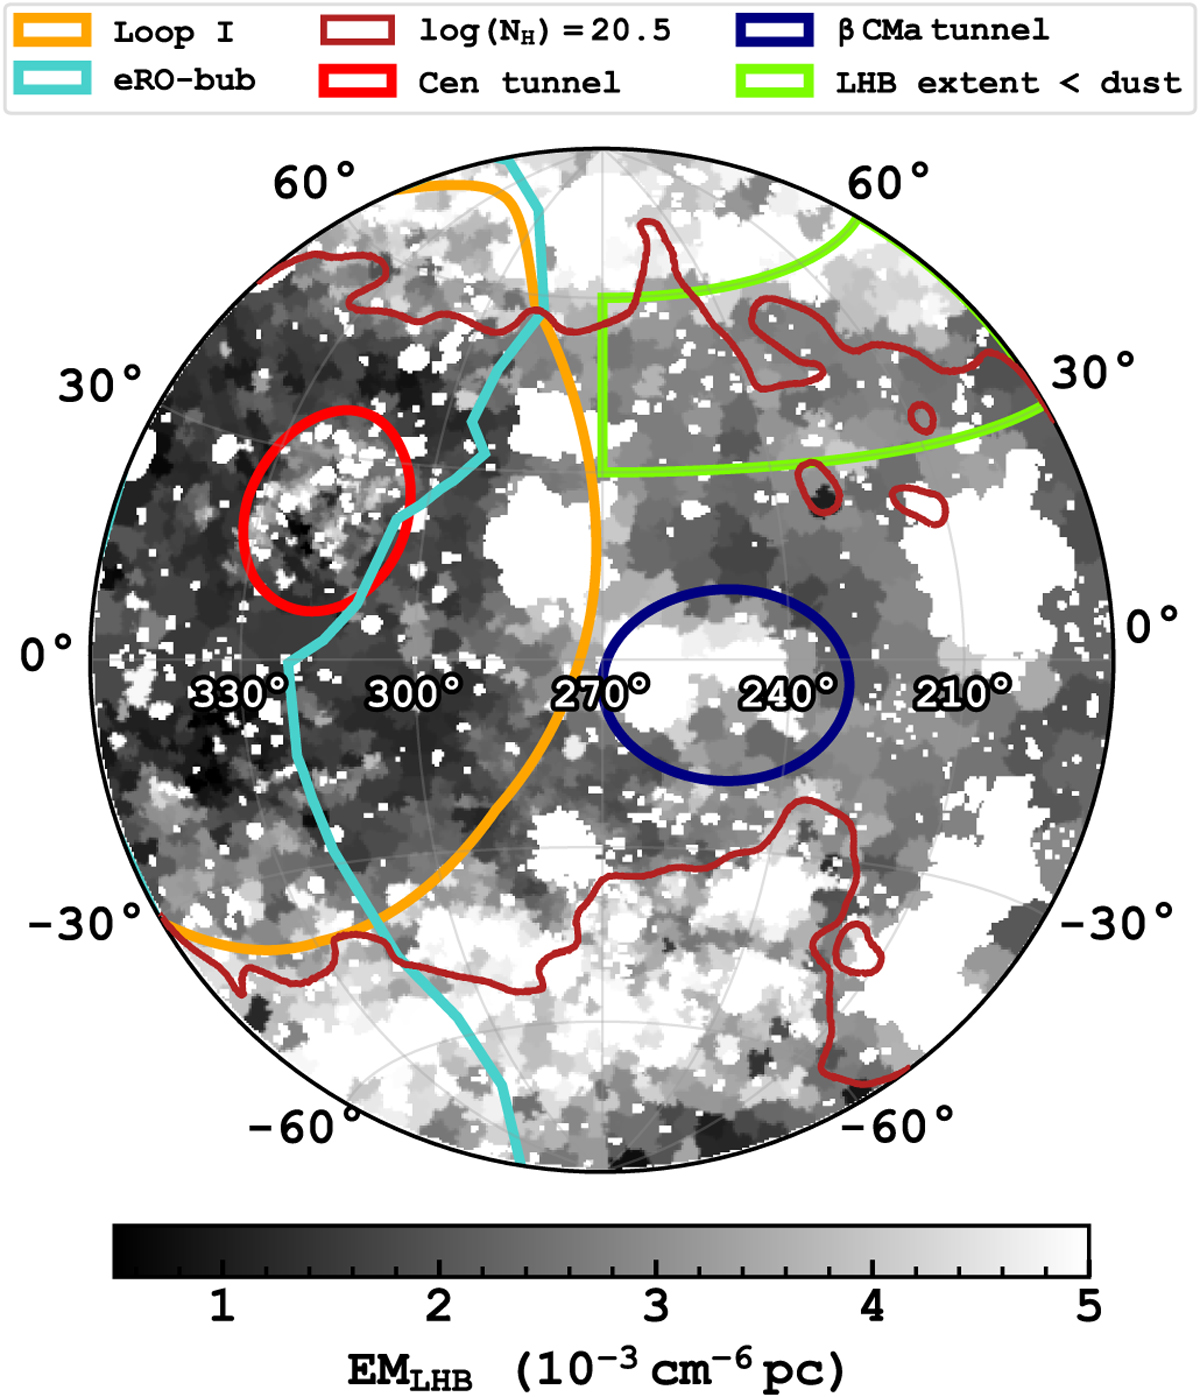
Fig. 7
Download original image
Finding chart for features discussed mainly in Sect. 3.4 and 4.2. The background image shows the emission measure of the LHB, which is a proxy of the extent of the LHB and is relevant for discussions (Sect. 4.2) on interstellar tunnels and anti-correlation with dust. The demarcation of the eROSITA bubbles is shown by the turquoise line, based on the 0.6–1.0 keV intensity map.
Current usage metrics show cumulative count of Article Views (full-text article views including HTML views, PDF and ePub downloads, according to the available data) and Abstracts Views on Vision4Press platform.
Data correspond to usage on the plateform after 2015. The current usage metrics is available 48-96 hours after online publication and is updated daily on week days.
Initial download of the metrics may take a while.