Open Access
Fig. 5
Download original image
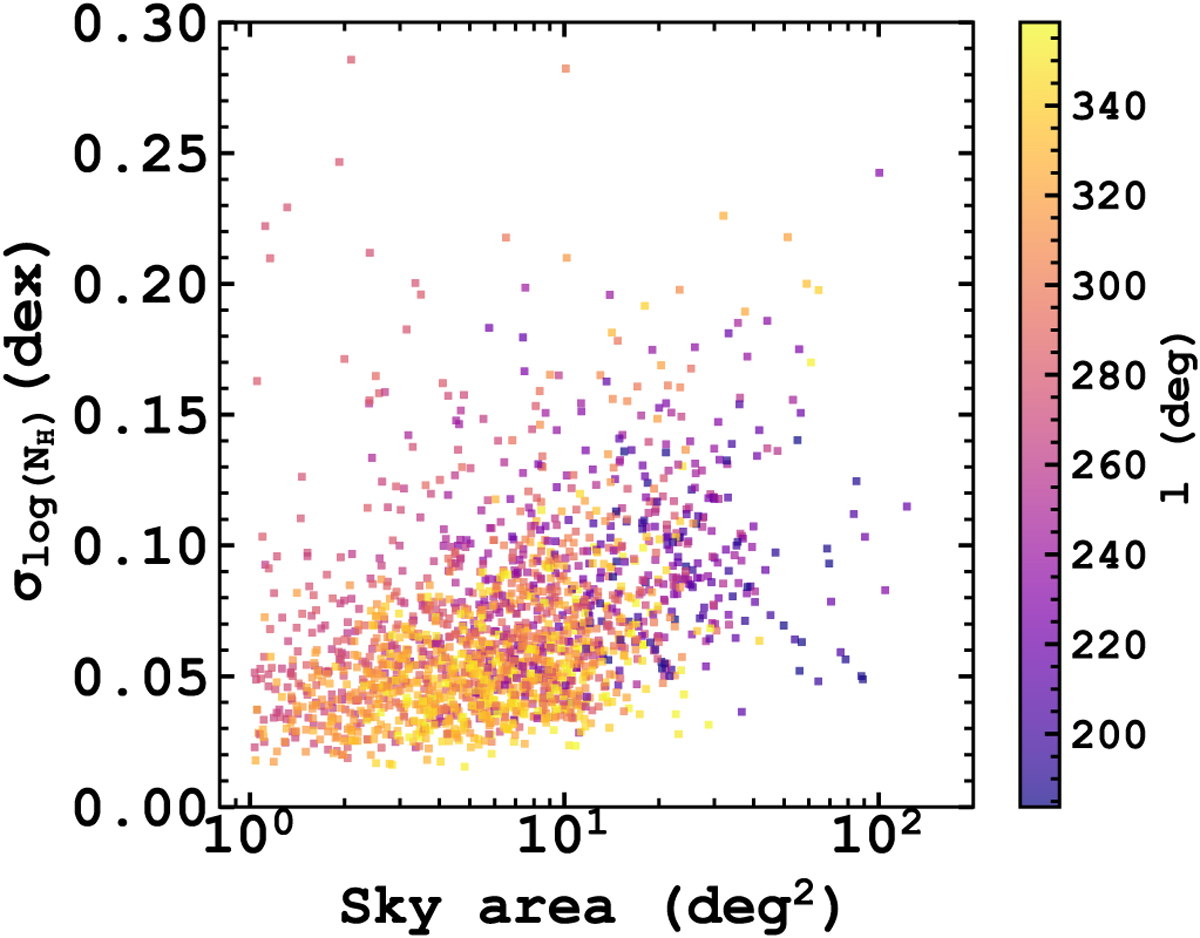
Scatter plot of ![]() against solid angle of contour bins. A positive correlation between
against solid angle of contour bins. A positive correlation between ![]() and the contour bin area can be seen, as larger bins tend to capture a larger spread in NH. The points are coloured according to their Galactic longitudes.
and the contour bin area can be seen, as larger bins tend to capture a larger spread in NH. The points are coloured according to their Galactic longitudes.
Current usage metrics show cumulative count of Article Views (full-text article views including HTML views, PDF and ePub downloads, according to the available data) and Abstracts Views on Vision4Press platform.
Data correspond to usage on the plateform after 2015. The current usage metrics is available 48-96 hours after online publication and is updated daily on week days.
Initial download of the metrics may take a while.