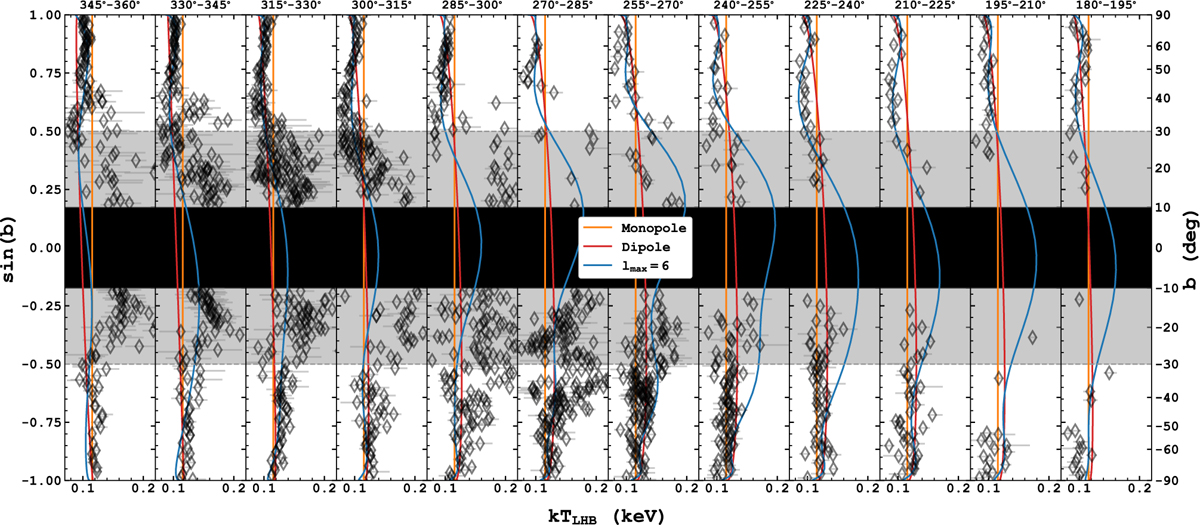
Fig. C.1
Download original image
Latitudinal profiles of kTLHB with their 1 σ error bars in all longitudinal stripes of 15° width in the western Galactic hemisphere. The vertical orange, red and blue lines show the corresponding monopole, dipole and lmax = 6 models, respectively. The black region indicates the Galactic plane region, which we masked for the temperature gradient analysis. Regions plotted on the white background indicate where the dipole model was fitted (|b| > 30°). The lmax model was fitted with the inclusion of data from the shaded region (|b| > 10°).
Current usage metrics show cumulative count of Article Views (full-text article views including HTML views, PDF and ePub downloads, according to the available data) and Abstracts Views on Vision4Press platform.
Data correspond to usage on the plateform after 2015. The current usage metrics is available 48-96 hours after online publication and is updated daily on week days.
Initial download of the metrics may take a while.