Fig. 3
Download original image
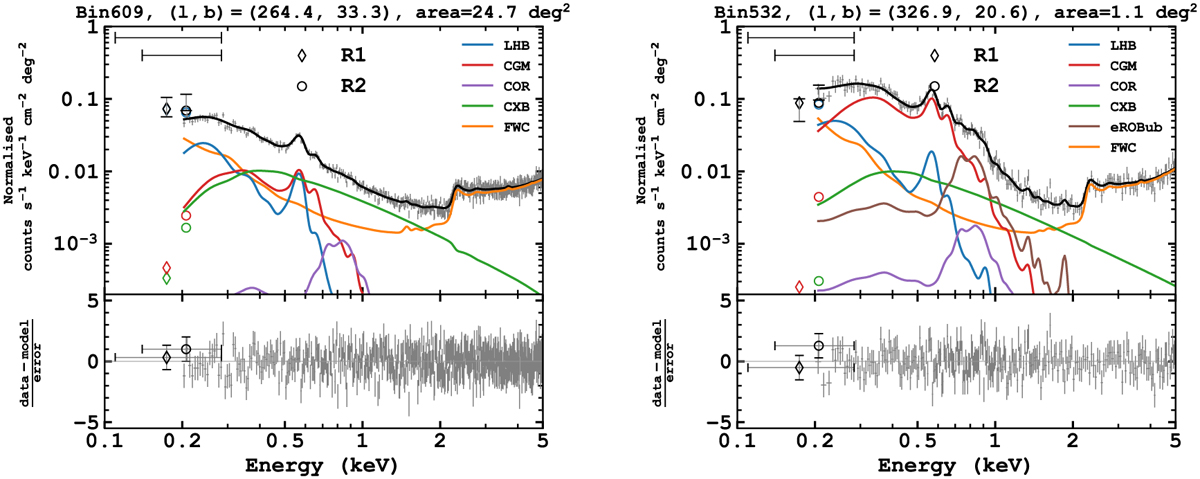
Example spectra outside (left) and inside (right) of the eROSITA bubbles, overlaid with the best-fit spectral models labelled in the legends. We modelled the eROSITA bubbles with an additional thermal component in brown. Both spectra have been divided by the effective area, aiming to bring the ROSAT R1 and R2 count rates into a reasonable range. This has the disadvantage of creating the fictitious jump of the instrumental background component above the gold absorption edge at ~2 keV. The horizontal error bars at the top left corners of the figures reflect the width of the ROSAT R1 and R2 bands.
Current usage metrics show cumulative count of Article Views (full-text article views including HTML views, PDF and ePub downloads, according to the available data) and Abstracts Views on Vision4Press platform.
Data correspond to usage on the plateform after 2015. The current usage metrics is available 48-96 hours after online publication and is updated daily on week days.
Initial download of the metrics may take a while.