Fig. 26
Download original image
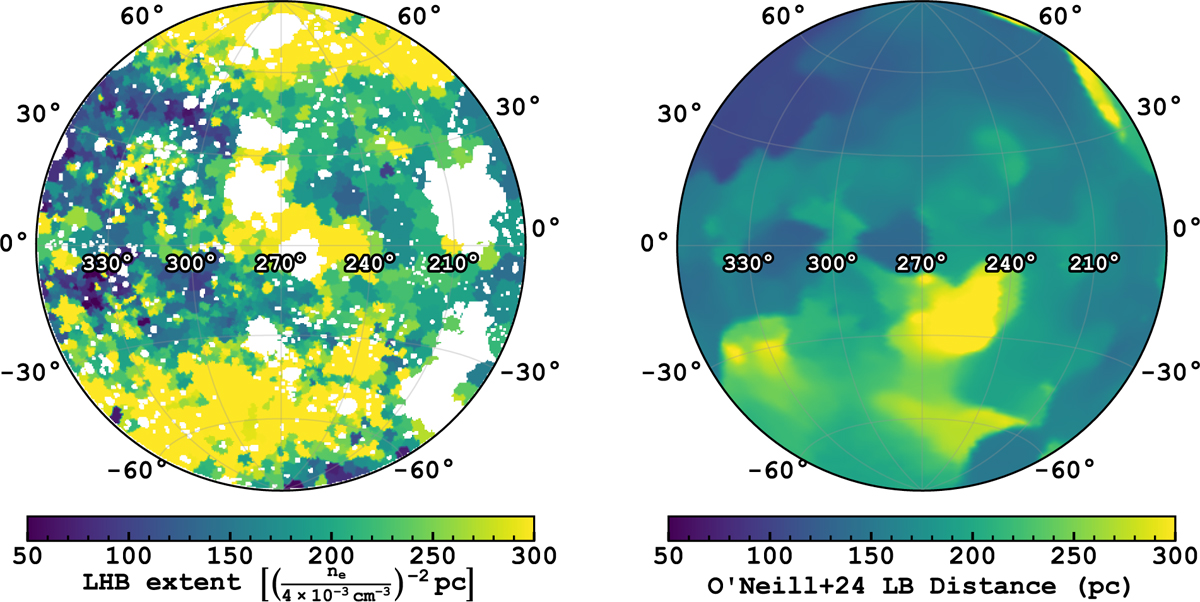
Comparison of the local (hot) bubble extent from X-ray and dust. Left: extent of the local hot bubble under the constant ne = 4 × 10⁻³ cm−3 assumption. Right: local bubble shell tracing the closest extinction peak inferred by O’Neill et al. (2024). An interactive comparison in 3D can be accessed from the accompanying website (Sect. 5).
Current usage metrics show cumulative count of Article Views (full-text article views including HTML views, PDF and ePub downloads, according to the available data) and Abstracts Views on Vision4Press platform.
Data correspond to usage on the plateform after 2015. The current usage metrics is available 48-96 hours after online publication and is updated daily on week days.
Initial download of the metrics may take a while.