Fig. 8
Download original image
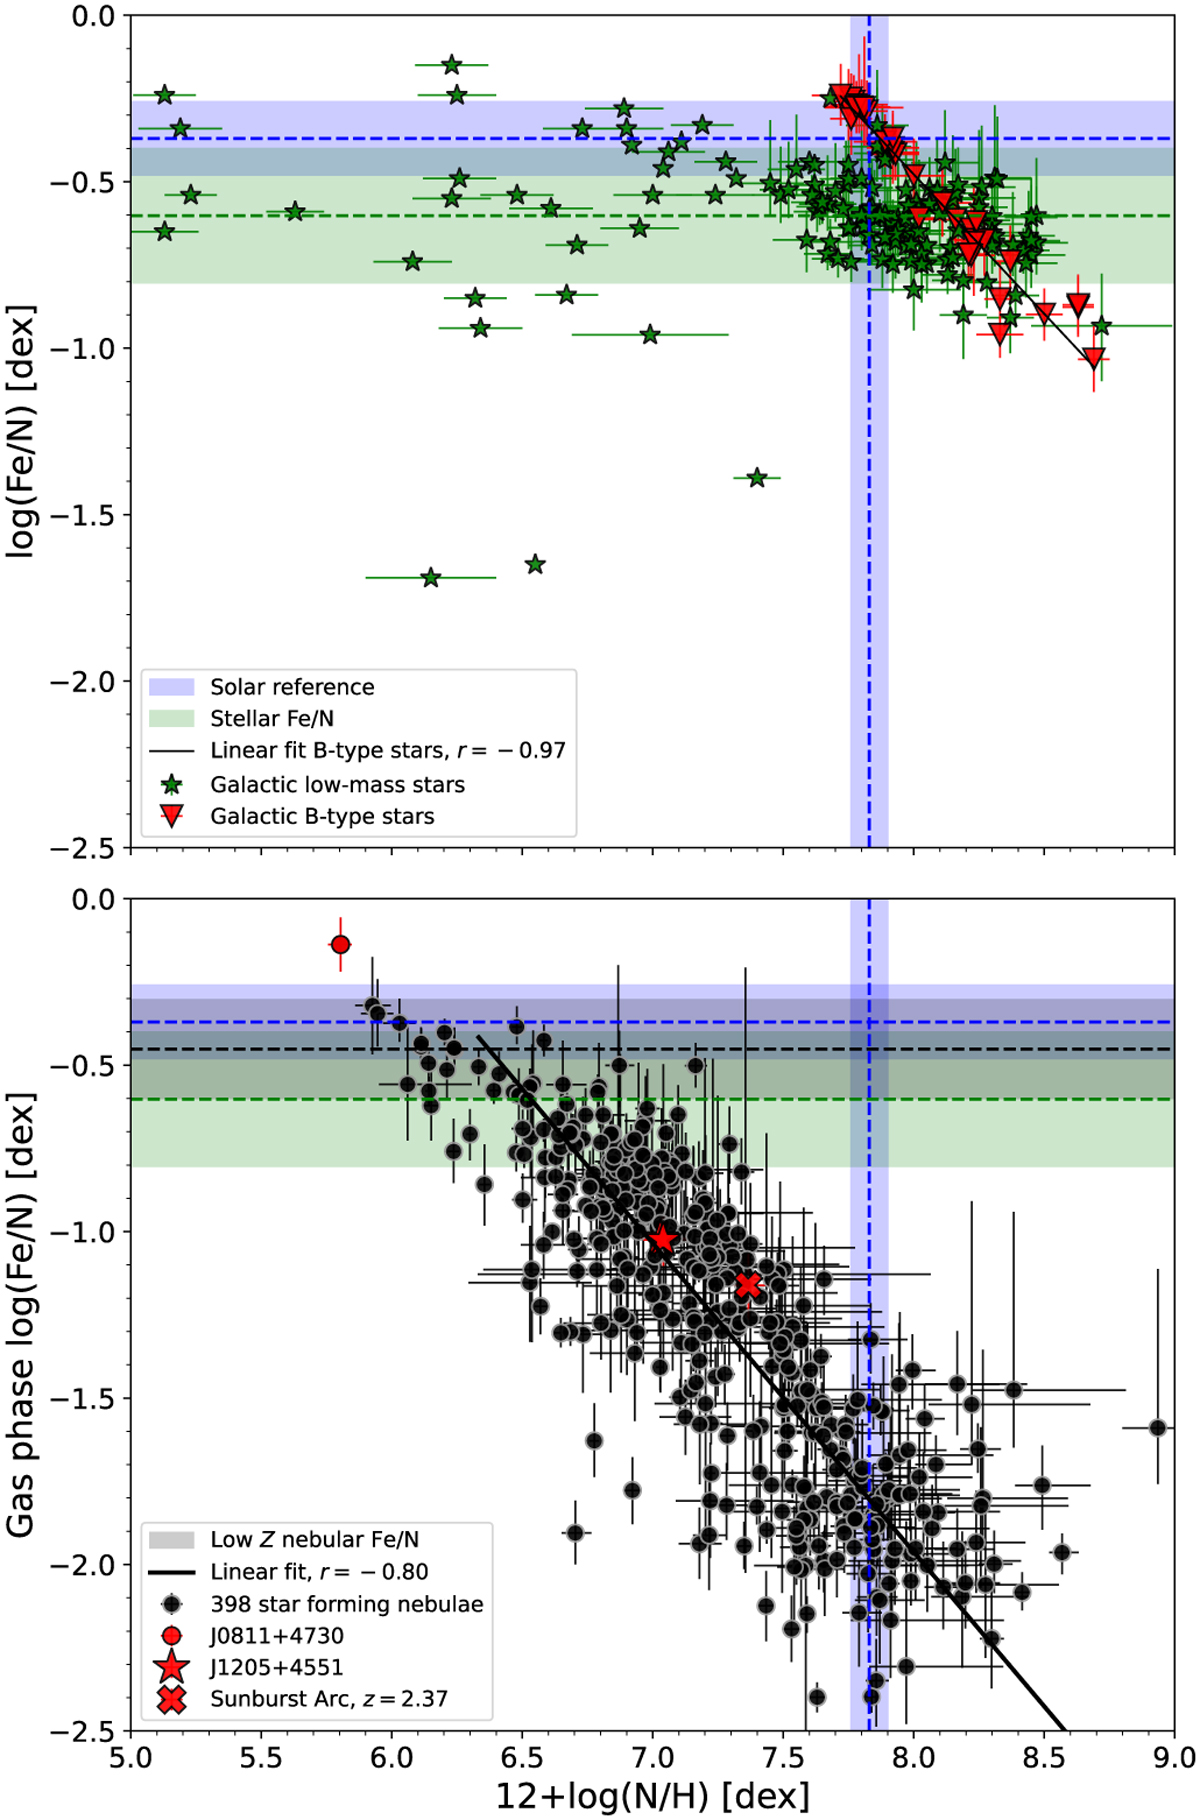
Distribution of log(Fe/N) vs 12+log(N/H). Upper panel: Milky Way stars from the sample described in Sect. 2. Lower panel: Galactic and extragalactic star-forming nebulae. The red dot highlights the position of J0811+4730 (Izotov et al. 2018), recently interpreted by Kojima et al. (2021) as enriched in Fe. The red star indicates the position of J1205+4551 (Izotov et al. 2017, 2021), a galaxy with elevated Fe/O abundances and evidence of WR activity. The red cross points out the location of the Sunburst Arc (Welch et al. 2024), a high-redshift (z = 2.37) galaxy recently observed by the JWST. Nebular N/H estimates consider the influence of nebular temperature variations (t2 > 0). The solar Fe/N and N/H abundances from Asplund et al. (2021) are shown for reference. r is the Pearson correlation coefficient of the linear fit.
Current usage metrics show cumulative count of Article Views (full-text article views including HTML views, PDF and ePub downloads, according to the available data) and Abstracts Views on Vision4Press platform.
Data correspond to usage on the plateform after 2015. The current usage metrics is available 48-96 hours after online publication and is updated daily on week days.
Initial download of the metrics may take a while.