Fig. 9
Download original image
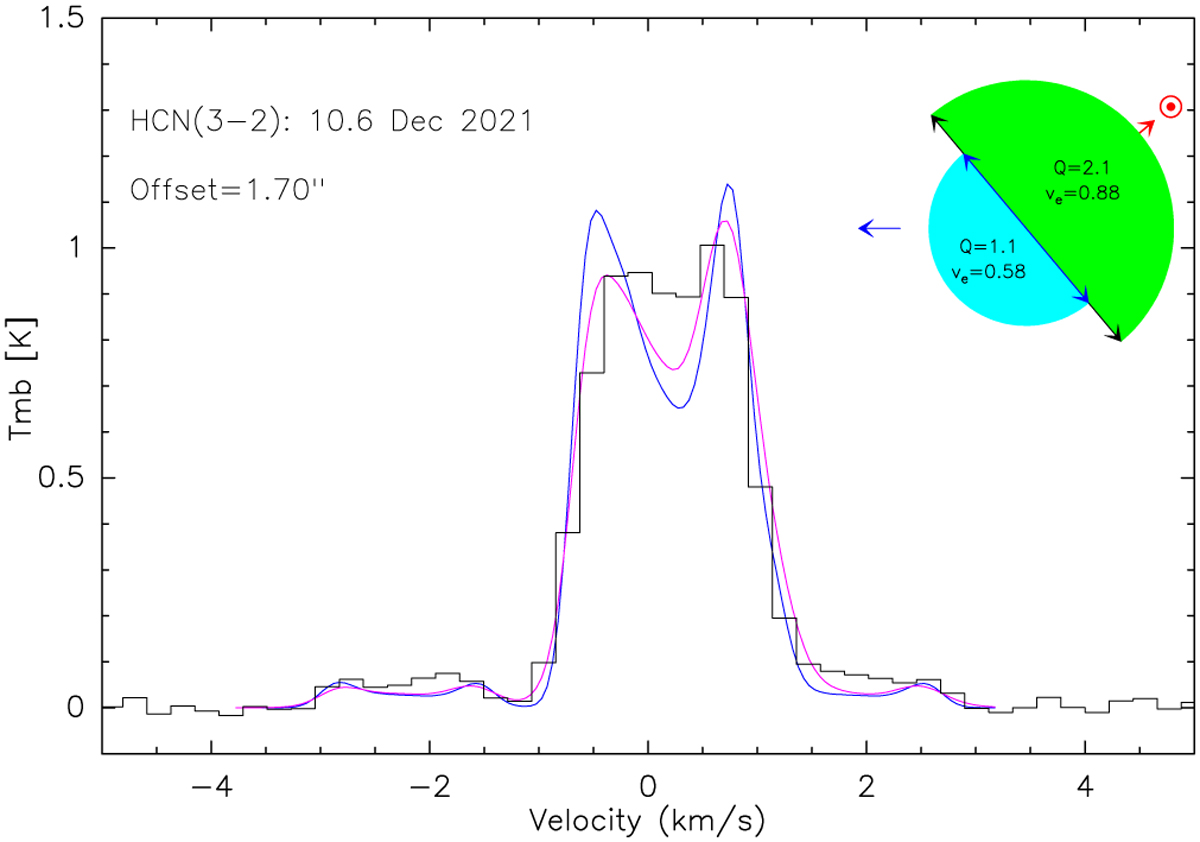
Average spectrum of the HCN(3–2) line observed from 8.5 to 13.4 December in comet C/2021 A1, with simulated profiles. The model in blue assumes a production rate of 2.1 × 1025 molecules s−1 at 0.88 km s−1 on the sunward hemisphere and 1.1 × 1025 molecules s−1 at 0.58 km s−1 on the opposite hemisphere mostly facing the observer. The mean phase angle is ~140°, and the tilt of 40°(or 140°) with respect to the comet-observer line of sight is taken into account in this 3D simulation, as depicted in the upper right. The model in purple uses variable velocities in both hemispheres (see text), with production rates of 2.3 × 1025 molecules s−1 and 0.9 × 1025 molecules s−1, respectively. The vertical axis is main beam brightness temperature in K. The horizontal axis is the Doppler velocity in the rest frame of the comet.
Current usage metrics show cumulative count of Article Views (full-text article views including HTML views, PDF and ePub downloads, according to the available data) and Abstracts Views on Vision4Press platform.
Data correspond to usage on the plateform after 2015. The current usage metrics is available 48-96 hours after online publication and is updated daily on week days.
Initial download of the metrics may take a while.