Open Access
Fig. 4
Download original image
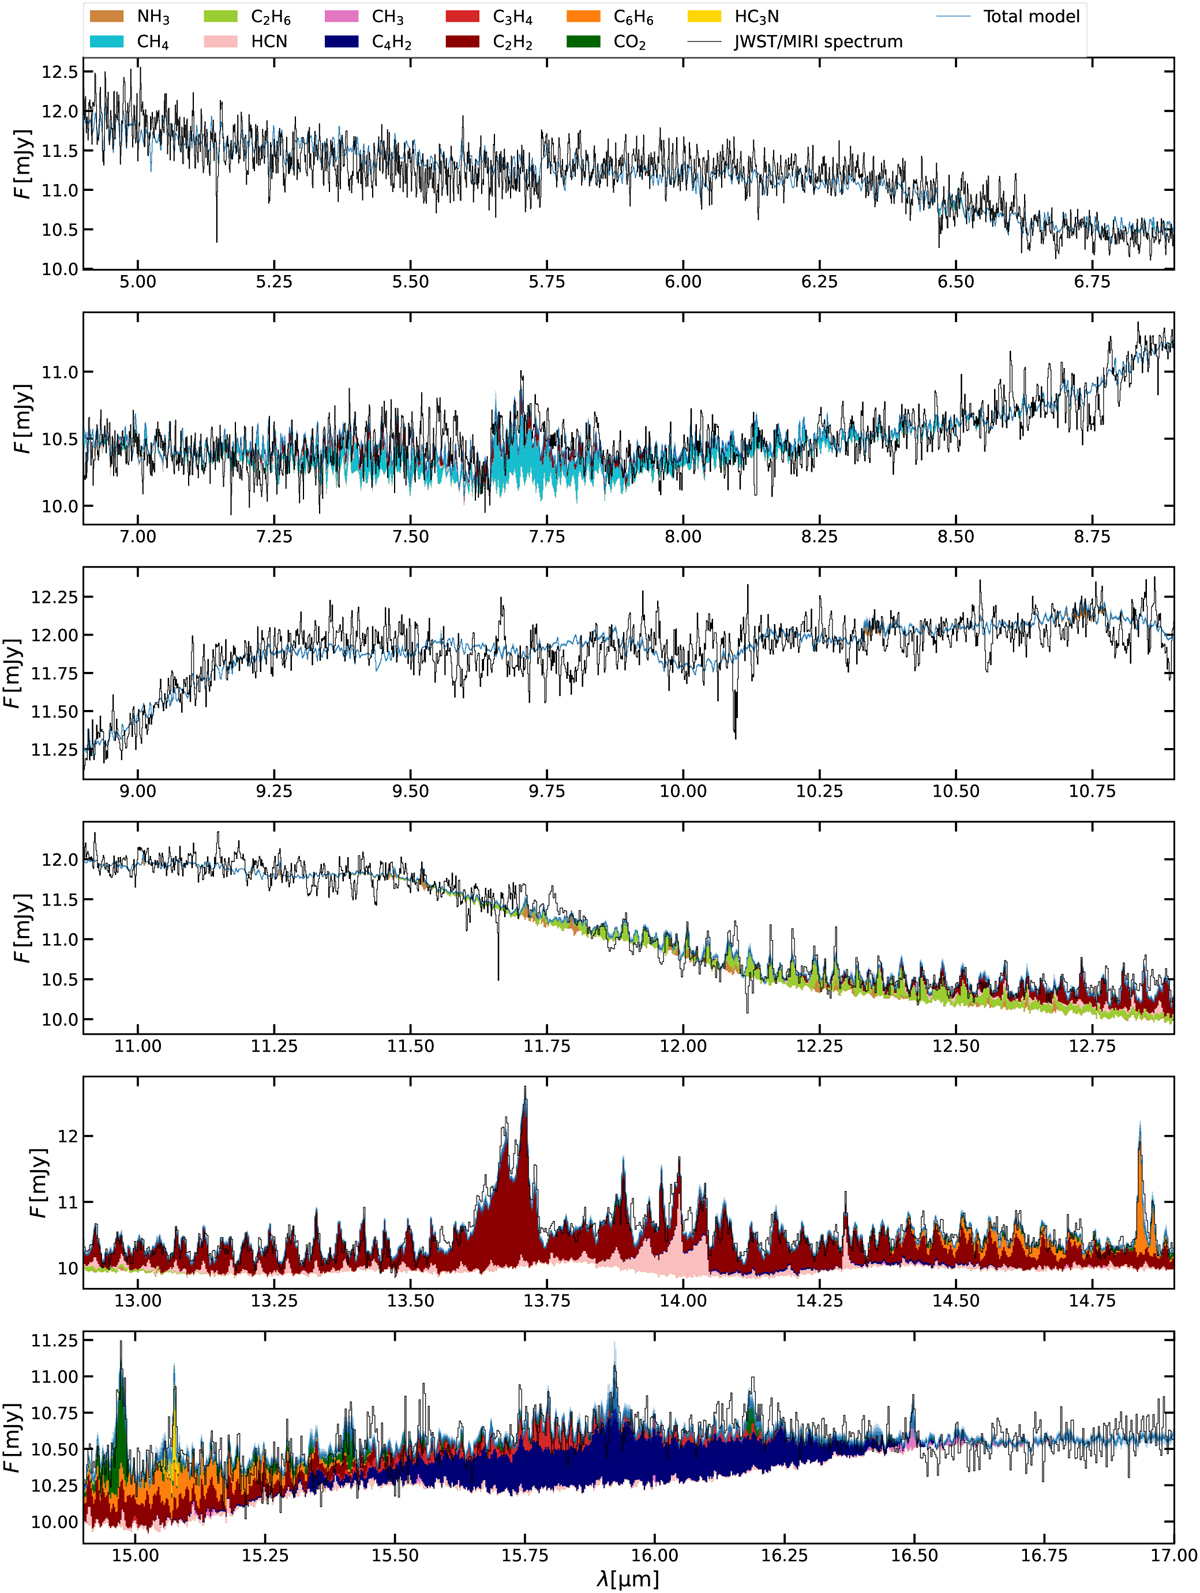
Molecular emission of the maximum likelihood model of Sz 28. The JWST/MIRI spectrum is shown in black. The median flux of the posterior models is shown in blue with the 1σ, 2σ, and 3σ flux levels being displayed in lighter colours. The cumulative contributions of all included molecules are shown in different colours.
Current usage metrics show cumulative count of Article Views (full-text article views including HTML views, PDF and ePub downloads, according to the available data) and Abstracts Views on Vision4Press platform.
Data correspond to usage on the plateform after 2015. The current usage metrics is available 48-96 hours after online publication and is updated daily on week days.
Initial download of the metrics may take a while.