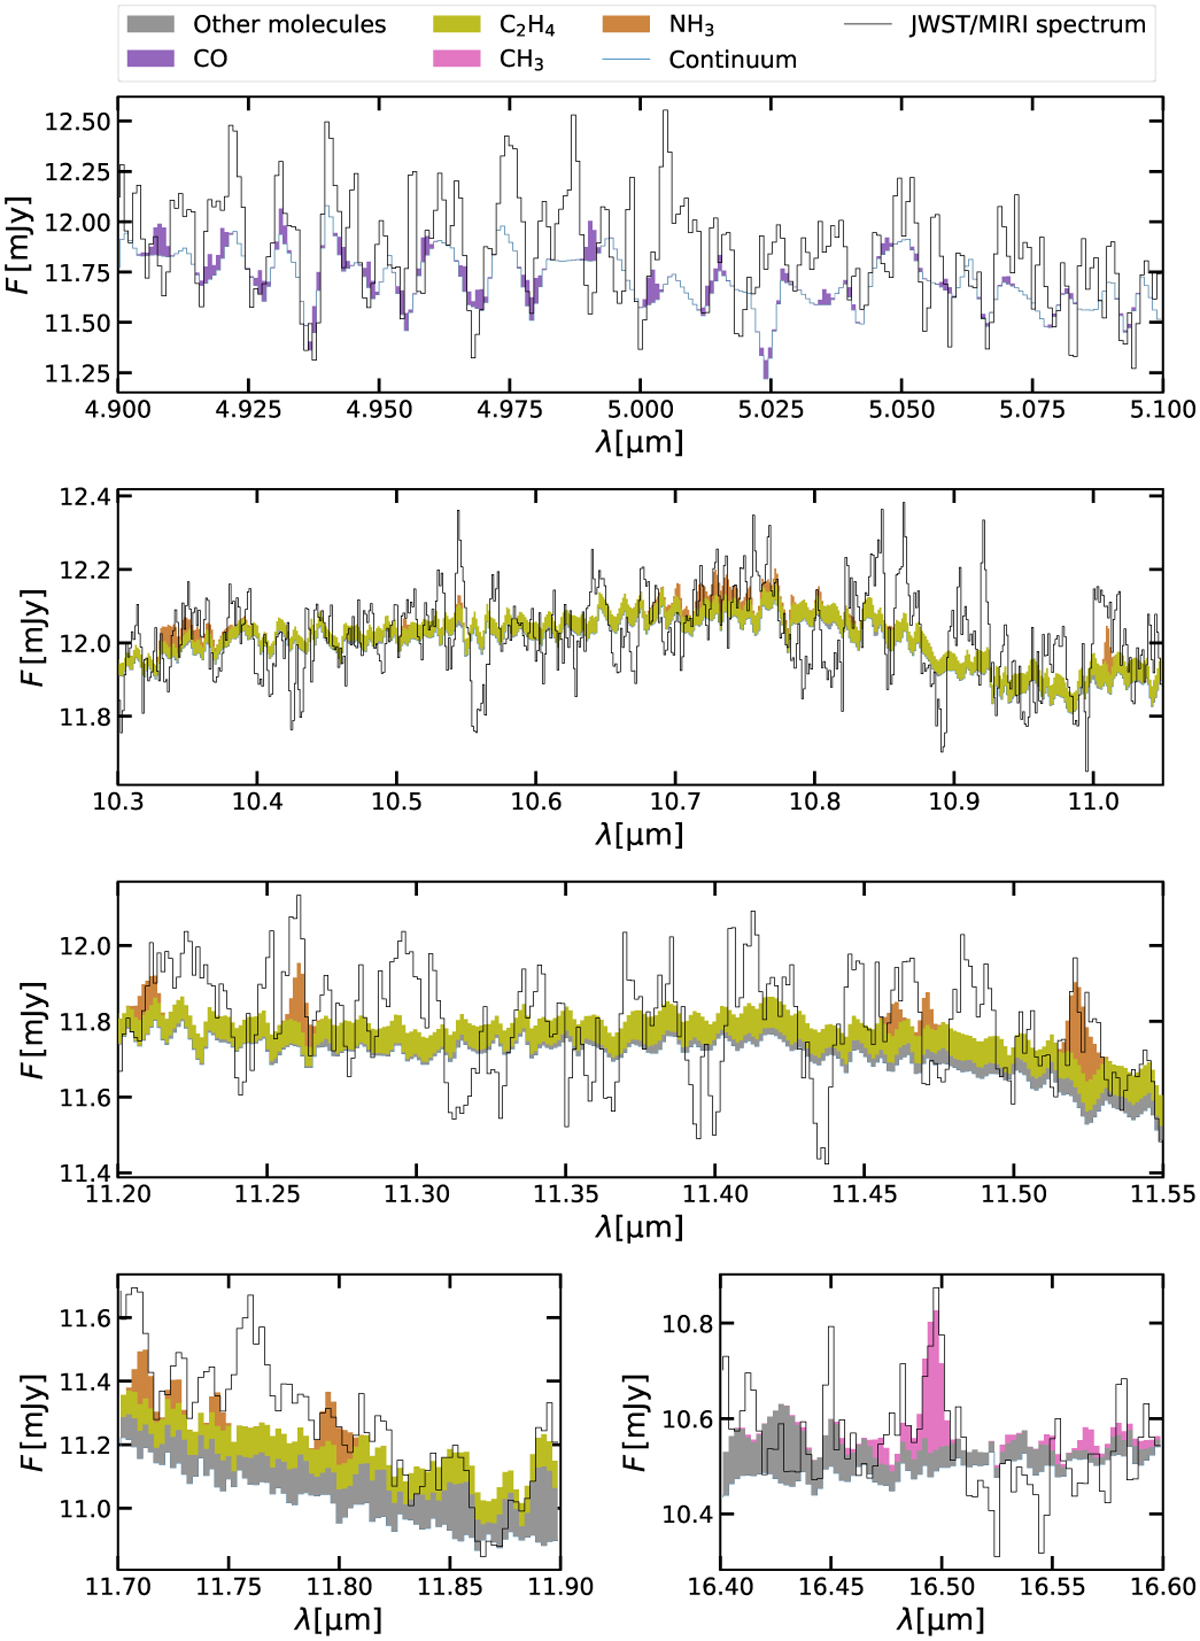
Fig. 2
Download original image
Zoom in on the molecular features of the maximum likelihood model for CO, C2H4, CH3, and NH3. The upper panel shows the wavelength region from 4.9 μm to 5.1 μm, where CO potentially emits. The middle ranks and lower left panel display three regions that exhibit NH3 emission and a C2H4 quasi-continuum. At the lower right panel (from 16.4 μm to 16.6 μm) CH3 emission can be seen. The black line shows the JWST/MIRI spectrum of Sz 28 with the blue line indicating the continuum, visible where no molecular emission is present.
Current usage metrics show cumulative count of Article Views (full-text article views including HTML views, PDF and ePub downloads, according to the available data) and Abstracts Views on Vision4Press platform.
Data correspond to usage on the plateform after 2015. The current usage metrics is available 48-96 hours after online publication and is updated daily on week days.
Initial download of the metrics may take a while.