Fig. 5
Download original image
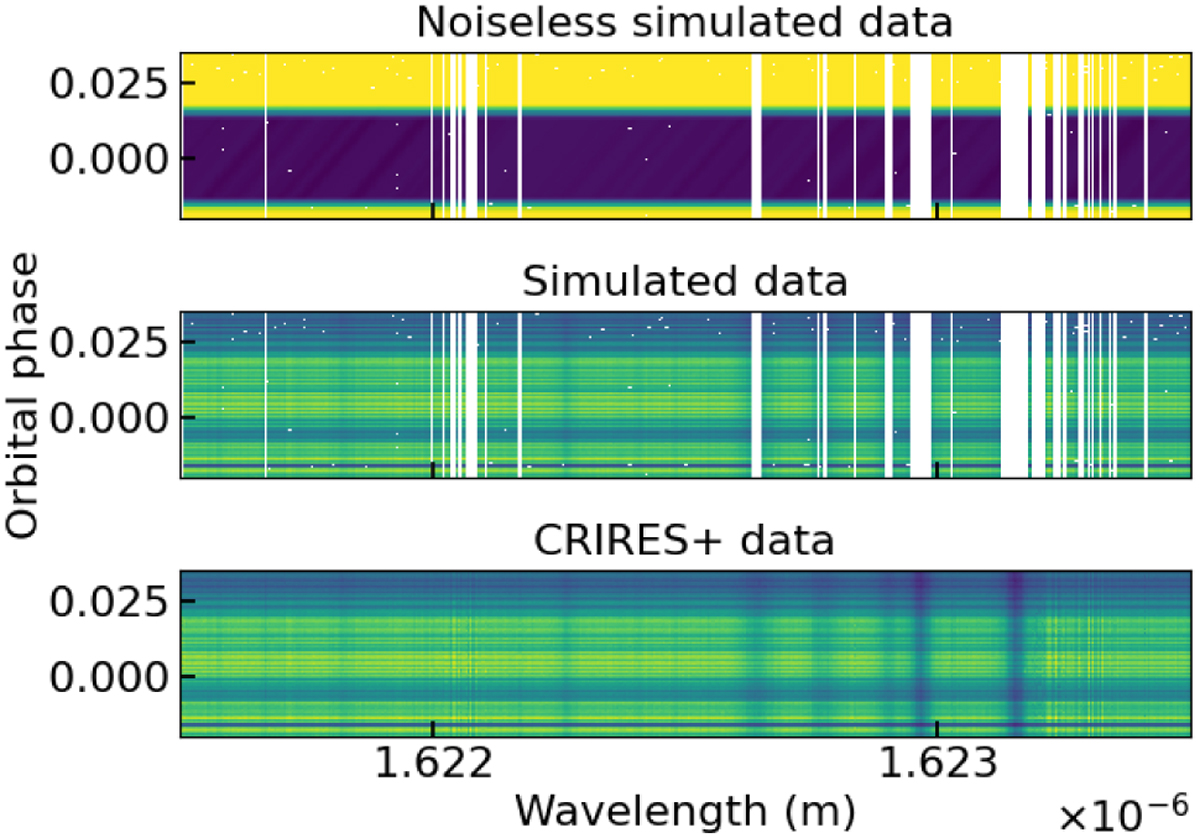
Simulated data (Z = 3, C/O = 0.55, no cloud) and CRIRES+ data of night 3, for a section of order 14. Top row: simulated data with deformation matrix and noise matrix removed. The ‘well’ around orbital phase 0 is due to the modelled transitting effect. The spectral lines of the planet’s atmosphere can be seen within the ‘well’ as faint dark traces. Middle row: simulated data, including the approximated deformation matrix and the modelled noise matrix. Bottom row: real CRIRES+ data, for comparison. The white pixels are pixels masked during the Polyfit preparing pipeline and the trimming (see Sec. 4.2 of the observations). The spectra are represented in arbitrary units.
Current usage metrics show cumulative count of Article Views (full-text article views including HTML views, PDF and ePub downloads, according to the available data) and Abstracts Views on Vision4Press platform.
Data correspond to usage on the plateform after 2015. The current usage metrics is available 48-96 hours after online publication and is updated daily on week days.
Initial download of the metrics may take a while.