| Issue |
A&A
Volume 697, May 2025
|
|
|---|---|---|
| Article Number | A31 | |
| Number of page(s) | 7 | |
| Section | Planets, planetary systems, and small bodies | |
| DOI | https://doi.org/10.1051/0004-6361/202453163 | |
| Published online | 05 May 2025 | |
Exploring the atmosphere of GJ 1132 b with CRIRES+
1
Instituto de Astrofísica de Canarias (IAC),
38200
La Laguna, Tenerife,
Spain
2
Deptartamento de Astrofísica, Universidad de La Laguna (ULL),
38206
La Laguna, Tenerife,
Spain
3
Department of Astronomy, University of Science and Technology of China,
Hefei
230026,
China
4
Instituto de Astrofísica de Andalucía (IAA-CSIC),
Glorieta de la Astronomía s/n,
18008
Granada,
Spain
5
INAF – Osservatorio Astronomico di Padova, Vicolo dell’Osservatorio,
Padova,
Italy
6
California Institute of Technology, NASA Jet Propulsion Laboratory,
4800 Oak Grove Dr,
La Cañada Flintridge,
CA
91011,
USA
7
Centro de Astrobiología, CSIC-INTA,
Camino Bajo del Castillo s/n,
28692
Villanueva de la Cañada, Madrid,
Spain
★ Corresponding authors: This email address is being protected from spambots. You need JavaScript enabled to view it.
; This email address is being protected from spambots. You need JavaScript enabled to view it.
Received:
26
November
2024
Accepted:
27
February
2025
Abstract
With a mass, radius, and mean density similar to Earth’s, the rocky planet GJ 1132 b is the first truly small planet for which an atmosphere detection was proposed. If confirmed, ultra-reduced magma outgassing is the only mechanism capable of producing HCN and H2O in large enough quantities to match the Hubble Space Telescope observations. The proposed atmosphere detection, however, was challenged by reanalysis of the same HST data by different teams. Recent James Webb Space Telescope observations returned ambiguous results due to the unaccounted for variability seen between two different visits. Here we report the analysis of three CRIRES+ transit observations of GJ 1132 b in order to determine the presence or absence of He I, HCN, CH4, and H2O in its atmosphere. We are unable to detect the presence of any of these species in the atmosphere of GJ 1132 b assuming a clear, H2-dominated atmosphere, although we can place upper limits for the volume mixing ratios of CH4, HCN, and H2O using injection tests and atmospheric retrievals. These retrieved upper limits show the capability of CRIRES+ at detecting chemical species in rocky exoplanets, if the atmosphere is H2 dominated. The detection of the atmospheres of small planets with high mean molecular weight, and the capability to distinguish between the variability introduced by stellar activity and/or the planetary atmosphere will require high-resolution spectrographs in the upcoming extremely large telescopes.
Key words: planets and satellites: atmospheres / planets and satellites: detection / planets and satellites: terrestrial planets / planets and satellites: individual: GJ 1132 b
© The Authors 2025
 Open Access article, published by EDP Sciences, under the terms of the Creative Commons Attribution License (https://creativecommons.org/licenses/by/4.0), which permits unrestricted use, distribution, and reproduction in any medium, provided the original work is properly cited.
This article is published in open access under the Subscribe to Open model. This email address is being protected from spambots. You need JavaScript enabled to view it. to support open access publication.
1 Introduction
The atmospheric characterization of temperate Earth-size rocky planets is a necessary step to accomplish the ultimate goal of searching for possible biosignatures in the atmospheres of habitable planets. Planets around M dwarfs are particularly suited for this endeavour because of the favorable planet/star contrast ratio and the fact that planets in the habitable zone of those stars have relatively short orbital periods.
While we are still far from reaching this goal, the atmospheres of several warm (Teq < 1000 K) mini-Neptunes and super-Earths have been explored using the Hubble Space Telescope (HST). Excluding the TRAPPIST-1 system planets, where more HST orbits may be required, there have been 12 published transmission spectra for planets with R < 3 R⊕; of these, five were reported as flat spectra (GJ 1214 b – Kreidberg et al. 2014; HD 97658 b – Knutson et al. 2014; L98-59 b, c, and d Damiano et al. 2022; Zhou et al. 2022, 2023) and seven have been reported with spectral features (55 Cnc e – Tsiaras et al. 2016; K2-18 b – Benneke et al. 2019; Tsiaras et al. 2019; HD 3167 c – Guilluy et al. 2021; Mikal-Evans et al. 2021; LHS 1140 b – Edwards et al. 2021; GJ 1132 b – Swain et al. 2021; TOI-270 d – Mikal-Evans et al. 2023; GJ 9827 d – Roy et al. 2023). More recently the James Webb Space Telescope (JWST) has become a much more powerful tool to explore the atmospheres of small planets. Still, the detection of an atmosphere in transmission often requires several transits to reach a sufficient signal-to-noise ratio (S/N). Even then, there is always the possibility of clouds or a very tenuous atmosphere returning a very precise but flat spectrum or the possibility of stellar contamination effects. The first examples are the recent JWST results on LHS 457b by Lustig-Yaeger et al. (2023) and GJ 486b by Moran et al. (2023). Such results are inconclusive on the existence or nature of a planetary atmosphere. However, robust atmospheric detections were obtained for K2-18 b (Madhusudhan et al. 2023) and TOI-270 d (Holmberg & Madhusudhan 2024; Benneke et al. 2024), also solving previous degeneracies between H2O and CH4. This body of work shows that the characterization of small planet atmospheres has begun. However, because small planets have the capacity to lose, regenerate, and totally transform their atmospheres, their study will profoundly deepen and broaden the exoplanet field.
With a mass (∼ 1.6 M⊕), radius (∼ 1.1 R⊕) and mean density (∼ 6.3 g/cm3) similar to Earth’s, the rocky planet GJ 1132 b (Berta-Thompson et al. 2015; Bonfils et al. 2018) is the smallest planet for which an atmosphere might have been detected. While GJ 1132 b is significantly hotter (Teq ≈ 530 K) than Earth, it is one of a handful of terrestrial transiting planets with accurate mass determination, and therefore of great interest for comparative planetology. GJ 1132 b is believed to have lost any possible primordial H/He envelope (Schaefer et al. 2016), although H from the primordial envelope could have been dissolved in the mantle (Chachan & Stevenson 2018; Kite et al. 2019). GJ 1132 b has also been identified as a candidate for reestablishment of an atmosphere by mantle outgassing (Kite et al. 2020) and the possibility of a steam atmosphere and the presence of a substantial O2 layer have been theoretically explored (Schaefer et al. 2016).
Early ground-based multiband photometry suggested the presence of H2O and/or CH4 to explain the absorption features observed in the z and K bands (Southworth et al. 2017). However, another ground-based optical spectrum did not show any evident atmospheric modulation (Diamond-Lowe et al. 2018). HST/STIS searches for the Lyα transit of GJ 1132 b were not successful neither, leading the authors to conclude that any original H/He envelope had been lost (Waalkes et al. 2019).
Using data from HST WFC3, the transmission spectrum of GJ 1132 b was obtained. Swain et al. (2021) analyzed the data and reported the spectral signatures of aerosol scattering, HCN, and CH4 in a low mean molecular weight atmosphere, an unexpected composition that was the subject of an extensive modeling effort. A combination of atmospheric loss, thermal/photochemical, and geochemical modeling, identified ultra-reduced magma outgassing as a plausible mechanism capable of producing HCN and CH4 in quantities matching the observations (Swain et al. 2021). However, a reanalysis of the same WFC3 data obtained discrepant results. Both Mugnai et al. (2021) and Libby-Roberts et al. (2022) reported no detections of molecular signatures and their transmission spectrum was best fit with a flat-line model. Their results suggest that the planet does not have a clear primordial, hydrogen-dominated atmosphere, and that instead, GJ 1132 b could have either a cloudy hydrogen-dominated atmosphere, a very enriched secondary atmosphere, or an airless/tenuous atmosphere.
More recently the JWST observed two transits of GJ 1132 b with the NIRSpec G395H configuration. However, rather than solving the issue, the JWST data exhibit substantial differences between the two visits (May et al. 2023). The first transit was consistent with a H2O-dominated atmosphere with CH4 and N2O, or with stellar contamination from unocculted starspots, while the second transit returned a featureless transmission spectrum. The authors could not identify the source of this differences/variability. Xue et al. (2024) observed GJ 1132 b’s thermal emission (secondary eclipse) with the Mid-Infrared Instrument Low-Resolution Spectrometer (MIRI/LRS) on the JWST, and concluded that the planet likely does not have a significant atmosphere. Thus the existence and composition of GJ 1132 b’s atmosphere remains unsolved. Here we present our attempt to explore this elusive planet’s atmosphere using ground-based high-resolution spectroscopy.
2 Observations and data reduction
We observed three transits of GJ 1132 b on December 14, 2021, February 9, 2022 and January 22, 2023 with the CRIRES+ high-resolution spectrograph mounted on the Very Large Telescope (Dorn et al. 2023). The first transit was carried out in Y-band with the Y1029 wavelength setting to search for the Helium 1083 nm lines. The other two transits were performed in H-band with the H1559 configuration to search for molecules such as HCN, CH4, and H2O. We used the 0.2″ slit to achieve a high spectral resolution (R ∼ 120 000). The observations were performed in staring mode, and we used the adaptive optics system. The exposure time was set to 300 s. Each night’s observation lasted for approximately 3 hours. For the first observation we obtained 33 spectra with 10 in-transit spectra. For the other two nights, we obtained 32 spectra, which consists of 9 spectra during transit and 23 spectra out of transit for each night (see Table 1).
Observation logs.
We reduced the raw spectra using the CRIRES+ pipeline. The pipeline handles calibrations including the dark subtraction, flat-fielding and wavelength calibrations. The science frame was reduced with the cr2res_obs_staring command. The reduced spectrum of the Y1029 wavelength setting has 9 spectral orders, covering the wavelengths from 950 to 1120 nm. For the H1559 wavelength setting, the spectrum consists of 8 spectral orders from 1460 to 1820 nm. We discarded the reddest order of the H1559 spectrum because it has low flux with strong telluric absorption. The wavelength solution provided by the pipeline has a slight offset around a few km s−1. We therefore refined the wavelength solution with telluric lines using the molecfit software (Smette et al. 2015). We further calculated the spectral drifts between consecutive exposures during the observing night. The drifts are below 0.1 pixel during the observation and we subsequently corrected the drift for each spectrum.
For each exposure frame, we normalized the spectra order-by-order and then merged the spectra into a one-dimensional spectrum. We discarded the data points with low S/N. About 10% of the data points were discarded. These discarded points are mostly at wavelengths of strong telluric lines.
3 Results
3.1 He I transmission spectroscopy
The transit data observed in 2021 with the Y1029 wavelength setting were used to search for the He I metastable triplet lines located at air rest wavelengths of 1082.909, 1083.025, and 1083.034 nm. We first removed the telluric and stellar lines using the SYSREM algorithm (Tamuz et al. 2005). We found that with a SYSREM iteration number of two, the telluric and stellar lines around the He I wavelength are already well removed. Therefore, we chose to use this iteration number for the transmission spectrum calculation. We obtained the transmission spectral matrix by dividing the observed spectra with the computed SYSREM model (Gibson et al. 2020). The spectral matrix was initially calculated in the observer’s rest frame. We masked the ± 5 km s−1 region around the strong telluric OH emission line at 1083.1322 nm (air wavelength, Oliva et al. 2015) and subsequently shifted the matrix into the stellar rest frame by considering the barycentric Earth’s radial velocity (vbary) and stellar systemic velocity (vsys = 35.08 km s−1, Bonfils et al. 2018).
The final transmission spectral matrix is presented in Fig. 1. There is no obvious absorption signal along the expected trajectory of the He I lines. It can be seen that the strong telluric OH emission line has little effect on the He I lines as they only intersect at the end of the transit. We further computed the combined one-dimensional transmission spectrum. We first shifted the spectra into the planetary rest frame by correcting the radial velocity (RV) caused by planetary orbital motion. The orbital velocity was calculated using a semi-amplitude (Kp) of 102 km s−1, which was inferred from the planetary orbital parameters (Bonfils et al. 2018). We then averaged all the in-transit spectra to obtain the one-dimensional transmission spectrum (Fig. 2). There is also no prominent He I absorption in the combined transmission spectrum. We provide a 3σ He absorption upper limit of 3.6%, computed as three times the standard deviation of the transmission spectrum around the line of interest. Following the method described in the MOPYS project (Orell-Miquel et al. 2024), we put an upper limit on the observational mass-loss rate of 0.14 M⊕/Gyr.
Parameters used to calculated the spectral model.
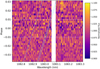 |
Fig. 1 Transmission spectral matrix around the He I 1083 nm lines. The three blue dashed lines denote the expected position of the planetary He I absoption lines. The horizontal white dashed lines indicate the beginning and end of the transit. The white region is the masked pixels around the strong telluric OH line. The spectra are represented in the stellar rest frame. |
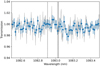 |
Fig. 2 Combined transmission spectrum around the He I 1083 nm triplet. The position of the He I lines are indicated by the vertical dashed lines. The grey line is the original spectrum and the blue dots are the binned spectrum with a bin size of 5 pixels (0.015 nm). |
3.2 Search for molecules
We used the two transits data taken with the H1559 setting to search for molecular absorption in GJ 1132 b’s atmosphere. To detect the molecular lines in the planetary spectrum, we applied the cross-correlation technique (Snellen et al. 2010). The detailed procedures are similar to the procedures described in Yan et al. (2023). We first employed the SYSREM algorithm to remove the stellar and telluric lines imprinted on the observed spectra. Then we calculated the transmission spectral template of GJ 1132 b for two different atmospheric models. The first model has atmospheric parameters similar to the ones reported by Swain et al. (2021), but we did not include the aerosol-induced Rayleigh scattering slope in the model. Inclusion of the scattering slope would slightly reduce the depth of the spectral lines by about 100 to 200 ppm in the H band. The assumed atmosphere is H2-dominated with 0.5% HCN and 0.5% CH4 (volume mixing ratio), along with a cloud deck pressure (Pcloud) of 1 mbar and an isothermal temperature (Tiso) of 480 K. The second model has parameters similar to the retrieved results from the first transit observation in May et al. (2023). The model is H2O-dominated with 1% CH4 and we set Pcloud = 100 mbar and Tiso = 530 K. The calculation of the spectra was performed with the petitRADTRANS (Mollière et al. 2019) tool. We used the line list sources from ExoMol for HCN (Barber et al. 2014) and H2O (Polyansky et al. 2018) and from HITEMP for CH4 (Hargreaves et al. 2020). The computed spectral model is presented in Figure 3. The spectrum of Model 1 consists of both HCN and CH4 lines while the spectrum of Model 2 is mostly H2O lines. The overall line depth of Model 1 is significantly stronger than the line depth of Model 2 because of the lower mean molecular weight of Model 1 (see Table 2).
We generated a grid of template spectrum for each model with a step of 1 km s−1. The template grid was then cross-correlated with the SYSREM-processed observed data. We chose to calculate the weighted cross-correlation function (CCF), which uses the inverse of squared noise as the weight of each data point (Gibson et al. 2020). These CCFs were then used to compute the so-called Kp-map, which is obtained by adding up all the in-transit CCFs in the planetary rest frame for a given Kp value. The CCFs were initially calculated in the observer’s rest frame and we masked the ± 5 km s−1 region to avoid contamination by telluric H2O and CH4 lines. When generating the Kp-map, we shifted the CCFs to the planetary rest frame, taking into account vbary, vsys and the planetary orbital motion. To evaluate the detection significance, we calculated the CCF noise value of each Kp-map by computing the standard deviation of the regions with Kp between 50 and 200 km s−1 and RV between −150 and −50 km s−1 or 50 and 150 km s−1. The detection significance map was subsequently obtained by dividing the Kp-map by the corresponding noise value. We combined the Kp-maps from the two nights’ observation to achieve a higher S/N.
We were not able to detect the HCN and CH4 lines in Model 1 at the expected Kp of GJ 1132 b (102 km s−1). Fig. 4 presents the combined Kp-map of the two nights’ observation. We have tested different SYSREM iteration numbers from 1 to 10, but there is no significant signal on the Kp-map (Fig. 5). For Model 2, there is also no prominent signal at the expected Kp (Figs. 6 and 7), indicating that we did not detect the H2O signal in Model 2. Searches with simple models with individual molecules were equally unsuccessful.
To investigate whether our data are capable of detecting the atmospheric signal as presented in Model 1 and Model 2, we injected the model spectra into the observed data. The injection was only performed for the in-transit spectra and we shifted the model spectra with RVs corresponding to the planetary orbital motion. We then reduced the model-injected data in the same way as described above. For Model 1, the final Kp-map and the detection significance at different SYSREM iteration numbers are presented in Figs. 4 and 5. When the two nights data are combined, a clear signal reaching 5 σ appears at the expected Kp. Therefore, our data are, in principle, capable of detecting the HCN+CH4 signal in Model 1 if the species are indeed present in the atmosphere of GJ 1132 b. We also tested the scenario with aerosol scattering as reported in Swain et al. (2021), and the strength of the injected signal becomes weaker but still reaches 3.5 sigma. Therefore, we can largely rule out the atmospheric scenarios presented in Swain et al. (2021). For Model 2, we were not able to detect the injected data even when we enhance the line depth by three times (Figs. 6 and 7). Thus, the S/N of our data are not high enough to detect the weak H2O signal as presented in Model 2.
We also tested the method described in Cheverall et al. (2023) to optimize the best SYSREM iteration number. We computed the injection-only CCF by subtracting the model-injected CCF with the observation-only CCF. The final S/N at different SYSREM iterations of the injection-only CCF is presented as purple lines in the SYSREM evolution figures. The iteration numbers that provide the highest S/N values of the injection-only CCF were chosen to compute the Kp-maps in Figs. 4 and 6. The injection-only CCF also indicates whether the injected signal can be recovered. For example, the injected Model 1 spectrum can be recovered at the 4σ level for the night 2 data. On the other hand, the three-times enhanced Model 2 spectrum yields a signal below 3σ for the night 2 data.
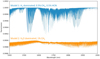 |
Fig. 3 Transmission spectrum models of GJ 1132 b. The spectrum of Model 2 is shifted along the y-axis for clarity. |
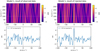 |
Fig. 4 Detection significance map from the two transits observations (left panel). The right panel is the expected detection significance map from the injection test for Model 1, which assumes an H2 dominated atmosphere with CH4 and HCN. |
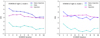 |
Fig. 5 SYSREM evolution with iteration number for the observed data (cyan points), the observed data with injected model (blue points), and the injected model alone (purple points). The results here are for Model 1 (i.e., HCN and CH4 lines). |
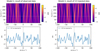 |
Fig. 6 Same as Fig. 4, but for the case of Model 2 (H2O. dominated atmosphere with.CH4). Here the injected model spectrum is enhanced by 3 times. |
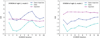 |
Fig. 7 Same as Fig. 5 but for Model 2 (i.e., mainly H2O lines). The injected model is enhanced by 3 times comparing to the original model in Fig. 3. |
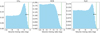 |
Fig. 8 Posterior distributions of the chemical mixing ratios from the retrieval of the observed transmission spectrum. The atmosphere model is assumed to be H2-dominated in the retrieval. The green dashed lines indicate the 3σ upper limits. |
3.3 Atmospheric retrieval
To constrain the upper limits of the chemical species, we further performed an atmospheric retrieval with the CRIRES+ data. Since our data are not capable of detecting chemical species for a H2O-dominated atmosphere, we only performed the retrieval for the case of an H2-dominated atmosphere.
The retrieval method is similar to the method in Yan et al. (2020, 2023). The input data are the observed spectral matrix after the removal of the stellar and telluric lines by SYSREM. This data matrix is in the observer’s rest frame. Here a SYSREM iteration number of 4 and 7 were used for night 2 and night 3, respectively. The model transmission spectrum is generated with petitRADTRANS, assuming an H2-dominated atmosphere with a cloud deck at 10−3 bar and an iso-thermal temperature of 530 K. We included CH4, HCN and H2O in the retrieval and set uniform priors for their volume mixing ratios from −10 to −1 (in logarithm). The mean molecular weight of the atmosphere is fixed to 2.2. Then we generated a model spectral matrix with the same dimensions as the observed data. For each intransit model spectrum, we shifted it with a RV corresponding to the expected position of the planetary lines in the observer’s rest frame, meaning that the planetary orbital RV, vbary, and vsys were all considered. Here we fixed the Kp to 102 km s−1. The parameter setup is summarized in Table 3. The model matrix is further processed with a fast SYSREM filter as suggested by Gibson et al. (2022). Then both the observed data matrix and the model matrix were filtered with a Gaussian high-pass filter with a σ of 31 points. We subsequently compared the two matrices with the emcee tool (Foreman-Mackey et al. 2013) to evaluate the model parameters in a Markov chain Monte Carlo (MCMC) approach. We run the MCMC for 20 000 steps with 200 walkers and set the first 10 000 steps as burn-in.
The retrieved result indicates non-detection of the chemical species, which is consistent with the cross-correlation result. Both the retrieval and the cross-correlation results hint that the atmosphere of GJ 1132 b is likely not H2 dominated with a substantial amount of CH4, HCN, or H2O. According to the posterior distributions (Fig. 8), we derived the 3σ upper limits for the volume mixing ratios of CH4, HCN and H2O as 10−2.4, 10−3.6, and 10−2.2 and the one-σ upper limits as 10−3.7, 10−5.5 and 10−3.7. These retrieved upper limits show the capability of CRIRES+ in detecting chemical species in rocky exoplanets, if the atmosphere is H2 dominated.
Retrieval setup.
4 Discussion and conclusions
The immediate aim of our work was to determine the presence or absence of HCN, CH4, and/or H2O in GJ 1132 b’s atmosphere, as well as the probable origin and evolution of such atmosphere. The HST HCN detection by Swain et al. (2021) was highly constraining and results in geochemical outgassing models invoking mantle material with C/O ≈3 and H2O mixing ratios <1 ppm. Previous observations with ground-based photometers and low-resolution spectrographs favor alternative scenarios with no thick atmosphere or with a higher H2O mixing ratio. These predictions could be decisively tested with a C/O inventory based on CRIRES+ spectroscopy in the ∼1−5 microns interval that include strong bands of H2O, CH4, and CO that are less obscured by the aerosol opacity dominating shorter wavelengths in the transmission spectrum of GJ 1132 b. Unfortunately we are unable to determine any molecular mixing ratios from our CRIRES+ observations, given our lack of atmospheric signatures detections.
The detection of H2O – or placing strict upper limits to its volume mixing ratio – in GJ 1132 b can potentially provide a strong test to the hypothesis that ultra-reduced magma is responsible for the outgassed atmosphere. The coupled geochemical/atmospheric modeling results used to interpret the HST transmission spectra (Swain et al. 2021) predict that GJ 1132 b is a dry, desiccated world; the presence of H2O in quantities substantially greater than a few ppm would challenge the hypothesis that the outgassing magma has an ultra-reduced composition. Testing the ultra-reduced magma hypothesis is important not only for our understanding of the origin of the atmosphere on GJ 1132 b, but also because it has broad implications in the context of how GJ 1132 b formed, and it raises the question of whether mantle ingassing of H routinely produces desiccated terrestrial worlds. Unfortunately, our 3σ upper limits for H2O of 10−2.2 is much larger than the required, a few ppm, upper limit to consider such an atmosphere as desiccated. On the other hand, our CRIRES+ results can largely rule-out the scenario from Swain et al. (2021), i.e. an H2-dominated atmosphere without thick cloud.
The metastable triplet of He I has been established as one of the best tracers for planetary mass loss accessible to ground-based telescopes (Nortmann et al. 2018). One of the most important aspects in interpreting Swain et al. (2021) results is whether the current epoch atmosphere is a remnant of the primordial H/He envelope or a regenerated atmosphere. The detection of a He I extended atmosphere would have suggested that GJ 1132 b has undergone orbital migration relatively recently (past 100 Myr) and thus retains a portion of the primordial H/He envelope. Our non-detection of He I in the planetary atmosphere supports the hypothesis that the present-epoch atmosphere is secondary, but it is also consistent with an airless/tenuous atmosphere. However, we must note that the detection of He I is highly dependent on the extreme ultraviolet (EUV) flux received from the host star, so it is possible that our non-detection responds to a low irradiance values at these wavelengths (Lampón et al. 2023).
The results from the first JWST visit to GJ 1132 b (May et al. 2023) were consistent with a H2O-dominated atmosphere with CH4 and N2O, but also with stellar contamination from unocculted starspots. The second visit, however, resulted in a flat spectrum, with the two observations separated by only 8 days, without a satifactory explanation. It is important to note that high-resolution data can in principle distinguish between the atmospheric signal and the often varying stellar contamination using the RV signature (i.e., the atmospheric signature has a Kp of 102 km/s, while the stellar contamination does not). Unfortunately, according to our recovery-injection test, two transits of CRIRES+ are not sufficient to detect the H2O spectral feature if the atmosphere has a high mean molecular weight such as in the H2O-dominated scenario. However, these retrieved upper limits show the capability of CRIRES+ in detecting chemical species in rocky exoplanets, if the atmosphere is H2 dominated. In the future, the capabilities of instruments such as ANDES at the Extremely Large Telescope will be able to probe the atmospheres of small rocky worlds (Palle et al. 2023) with high mean molecular weight, and to distinguish between the variability introduced by stellar activity and/or the planetary atmosphere.
Acknowledgements
We acknowledge financial support from the Agencia Estatal de Investigación of the Ministerio de Ciencia e Innovación MCIN/AEI/10.13039/501100011033 and the ERDF “A way of making Europe” through project PID2021-125627OB-C32, and from the Centre of Excellence “Severo Ochoa” award to the Instituto de Astrofisica de Canarias. F.Y. acknowledges the support by the National Natural Science Foundation of China (grant No. 42375118). G.M. acknowledges financial support from the Severo Ochoa grant CEX2021-001131-S and from the Ramón y Cajal grant RYC2022-037854I funded by MCIN/AEI/ 10.13039/501100011033 and FSE+. P. A. Miles-Páez acknowledges financial support from the grant RYC2021-031173-I funded by MCIN/AEI/ 10.13039/501100011033 and by the ‘European Union NextGenerationEU/PRTR’. TM acknowledges financial support from the Spanish Ministry of Science and Innovation (MICINN) through the Spanish State Research Agency, under the Severo Ochoa Program 2020-2023 (CEX2019-000920-S). We thank Guo Chen for useful discussions on model calculations. M.S. acknowledges the support of the PRIN INAF 2019 through the project “HOT-ATMOS” and INAF GO Large Grant 2023 GAPS-2.
References
- Barber, R. J., Strange, J. K., Hill, C., et al. 2014, MNRAS, 437, 1828 [CrossRef] [Google Scholar]
- Benneke, B., Roy, P.-A., Coulombe, L.-P., et al. 2024, ArXiv e-prints [arXiv:2403.03325] [Google Scholar]
- Benneke, B., Wong, I., Piaulet, C., et al. 2019, ApJ, 887, L14 [Google Scholar]
- Berta-Thompson, Z. K., Irwin, J., Charbonneau, D., et al. 2015, Nature, 527, 204 [Google Scholar]
- Bonfils, X., Almenara, J. M., Cloutier, R., et al. 2018, A&A, 618, A142 [NASA ADS] [CrossRef] [EDP Sciences] [Google Scholar]
- Chachan, Y., & Stevenson, D. J., 2018, ApJ, 854, 21 [NASA ADS] [CrossRef] [Google Scholar]
- Cheverall, C. J., Madhusudhan, N., & Holmberg, M., 2023, MNRAS, 522, 661 [NASA ADS] [CrossRef] [Google Scholar]
- Damiano, M., Hu, R., Barclay, T., et al. 2022, AJ, 164, 225 [Google Scholar]
- Diamond-Lowe, H., Berta-Thompson, Z., Charbonneau, D., & Kempton, E. M. R., 2018, AJ, 156, 42 [NASA ADS] [CrossRef] [Google Scholar]
- Dorn, R. J., Bristow, P., Smoker, J. V., et al. 2023, A&A, 671, A24 [NASA ADS] [CrossRef] [EDP Sciences] [Google Scholar]
- Edwards, B., Changeat, Q., Mori, M., et al. 2021, AJ, 161, 44 [Google Scholar]
- Foreman-Mackey, D., Hogg, D. W., Lang, D., & Goodman, J., 2013, PASP, 125, 306 [Google Scholar]
- Gibson, N. P., Merritt, S., Nugroho, S. K., et al. 2020, MNRAS, 493, 2215 [Google Scholar]
- Gibson, N. P., Nugroho, S. K., Lothringer, J., Maguire, C., & Sing, D. K., 2022, MNRAS, 512, 4618 [NASA ADS] [CrossRef] [Google Scholar]
- Guilluy, G., Gressier, A., Wright, S., et al. 2021, AJ, 161, 19 [Google Scholar]
- Hargreaves, R. J., Gordon, I. E., Rey, M., et al. 2020, ApJS, 247, 55 [NASA ADS] [CrossRef] [Google Scholar]
- Holmberg, M., & Madhusudhan, N., 2024, A&A, 683, L2 [NASA ADS] [CrossRef] [EDP Sciences] [Google Scholar]
- Kite, E. S., Fegley, Bruce, J., Schaefer, L., & Ford, E. B. 2019, ApJ, 887, L33 [NASA ADS] [CrossRef] [Google Scholar]
- Kite, E. S., Fegley, Bruce, J., Schaefer, L., & Ford, E. B. 2020, ApJ, 891, 111 [Google Scholar]
- Knutson, H. A., Benneke, B., Deming, D., & Homeier, D., 2014, Nature, 505, 66 [Google Scholar]
- Kreidberg, L., Bean, J. L., Désert, J.-M.,, et al. 2014, Nature, 505, 69 [Google Scholar]
- Lampón, M., López-Puertas, M., Sanz-Forcada, J., et al. 2023, A&A, 673, A140 [NASA ADS] [CrossRef] [EDP Sciences] [Google Scholar]
- Libby-Roberts, J. E., Berta-Thompson, Z. K., Diamond-Lowe, H., et al. 2022, AJ, 164, 59 [NASA ADS] [CrossRef] [Google Scholar]
- Lustig-Yaeger, J., Fu, G., May, E. M., et al. 2023, Nat. Astron., 7, 1317 [NASA ADS] [CrossRef] [Google Scholar]
- Madhusudhan, N., Sarkar, S., Constantinou, S., et al. 2023, ApJ, 956, L13 [NASA ADS] [CrossRef] [Google Scholar]
- May, E. M., MacDonald, R. J., Bennett, K. A., et al. 2023, ApJ, 959, L9 [CrossRef] [Google Scholar]
- Mikal-Evans, T., Crossfield, I. J. M., Benneke, B., et al. 2021, AJ, 161, 18 [Google Scholar]
- Mikal-Evans, T., Madhusudhan, N., Dittmann, J., et al. 2023, AJ, 165, 84 [NASA ADS] [CrossRef] [Google Scholar]
- Mollière, P., Wardenier, J. P., van Boekel, R., et al. 2019, A&A, 627, A67 [Google Scholar]
- Moran, S. E., Stevenson, K. B., Sing, D. K., et al. 2023, ApJ, 948, L11 [NASA ADS] [CrossRef] [Google Scholar]
- Mugnai, L. V., Modirrousta-Galian, D., Edwards, B., et al. 2021, AJ, 161, 284 [CrossRef] [Google Scholar]
- Nortmann, L., Pallé, E., Salz, M., et al. 2018, Science, 362, 1388 [Google Scholar]
- Oliva, E., Origlia, L., Scuderi, S., et al. 2015, A&A, 581, A47 [NASA ADS] [CrossRef] [EDP Sciences] [Google Scholar]
- Orell-Miquel, J., Murgas, F., Pallé, E., et al. 2024, A&A, 689, A179 [NASA ADS] [CrossRef] [EDP Sciences] [Google Scholar]
- Palle, E., Biazzo, K., Bolmont, E., et al. 2023, ArXiv e-prints [arXiv:2311.17075] [Google Scholar]
- Polyansky, O. L., Kyuberis, A. A., Zobov, N. F., et al. 2018, MNRAS, 480, 2597 [NASA ADS] [CrossRef] [Google Scholar]
- Roy, P.-A., Benneke, B., Piaulet, C., et al. 2023, ApJ, 954, L52 [NASA ADS] [CrossRef] [Google Scholar]
- Schaefer, L., Wordsworth, R. D., Berta-Thompson, Z., & Sasselov, D., 2016, ApJ, 829, 63 [NASA ADS] [CrossRef] [Google Scholar]
- Smette, A., Sana, H., Noll, S., et al. 2015, A&A, 576, A77 [NASA ADS] [CrossRef] [EDP Sciences] [Google Scholar]
- Snellen, I. A. G., de Kok, R. J., de Mooij, E. J. W., & Albrecht, S., 2010, Nature, 465, 1049 [Google Scholar]
- Southworth, J., Mancini, L., Madhusudhan, N., et al. 2017, AJ, 153, 191 [CrossRef] [Google Scholar]
- Swain, M. R., Estrela, R., Roudier, G. M., et al. 2021, AJ, 161, 213 [NASA ADS] [CrossRef] [Google Scholar]
- Tamuz, O., Mazeh, T., & Zucker, S., 2005, MNRAS, 356, 1466 [Google Scholar]
- Tsiaras, A., Rocchetto, M., Waldmann, I. P., et al. 2016, ApJ, 820, 99 [NASA ADS] [CrossRef] [Google Scholar]
- Tsiaras, A., Waldmann, I. P., Tinetti, G., Tennyson, J., & Yurchenko, S. N., 2019, Nat. Astron., 3, 1086 [Google Scholar]
- Waalkes, W. C., Berta-Thompson, Z., Bourrier, V., et al. 2019, AJ, 158, 50 [NASA ADS] [CrossRef] [Google Scholar]
- Xue, Q., Bean, J. L., Zhang, M., et al. 2024, ApJ, 973, L8 [NASA ADS] [CrossRef] [Google Scholar]
- Yan, F., Pallé, E., Reiners, A., et al. 2020, A&A, 640, L5 [NASA ADS] [CrossRef] [EDP Sciences] [Google Scholar]
- Yan, F., Nortmann, L., Reiners, A., et al. 2023, A&A, 672, A107 [NASA ADS] [CrossRef] [EDP Sciences] [Google Scholar]
- Zhou, L., Ma, B., Wang, Y., & Zhu, Y., 2022, AJ, 164, 203 [CrossRef] [Google Scholar]
- Zhou, L., Ma, B., Wang, Y.-H., & Zhu, Y.-N. 2023, Res. Astron. Astrophys., 23, 025011 [Google Scholar]
All Tables
All Figures
|
Fig. 1 Transmission spectral matrix around the He I 1083 nm lines. The three blue dashed lines denote the expected position of the planetary He I absoption lines. The horizontal white dashed lines indicate the beginning and end of the transit. The white region is the masked pixels around the strong telluric OH line. The spectra are represented in the stellar rest frame. |
| In the text | |
|
Fig. 2 Combined transmission spectrum around the He I 1083 nm triplet. The position of the He I lines are indicated by the vertical dashed lines. The grey line is the original spectrum and the blue dots are the binned spectrum with a bin size of 5 pixels (0.015 nm). |
| In the text | |
|
Fig. 3 Transmission spectrum models of GJ 1132 b. The spectrum of Model 2 is shifted along the y-axis for clarity. |
| In the text | |
|
Fig. 4 Detection significance map from the two transits observations (left panel). The right panel is the expected detection significance map from the injection test for Model 1, which assumes an H2 dominated atmosphere with CH4 and HCN. |
| In the text | |
|
Fig. 5 SYSREM evolution with iteration number for the observed data (cyan points), the observed data with injected model (blue points), and the injected model alone (purple points). The results here are for Model 1 (i.e., HCN and CH4 lines). |
| In the text | |
|
Fig. 6 Same as Fig. 4, but for the case of Model 2 (H2O. dominated atmosphere with.CH4). Here the injected model spectrum is enhanced by 3 times. |
| In the text | |
|
Fig. 7 Same as Fig. 5 but for Model 2 (i.e., mainly H2O lines). The injected model is enhanced by 3 times comparing to the original model in Fig. 3. |
| In the text | |
|
Fig. 8 Posterior distributions of the chemical mixing ratios from the retrieval of the observed transmission spectrum. The atmosphere model is assumed to be H2-dominated in the retrieval. The green dashed lines indicate the 3σ upper limits. |
| In the text | |
Current usage metrics show cumulative count of Article Views (full-text article views including HTML views, PDF and ePub downloads, according to the available data) and Abstracts Views on Vision4Press platform.
Data correspond to usage on the plateform after 2015. The current usage metrics is available 48-96 hours after online publication and is updated daily on week days.
Initial download of the metrics may take a while.