Fig. 4
Download original image
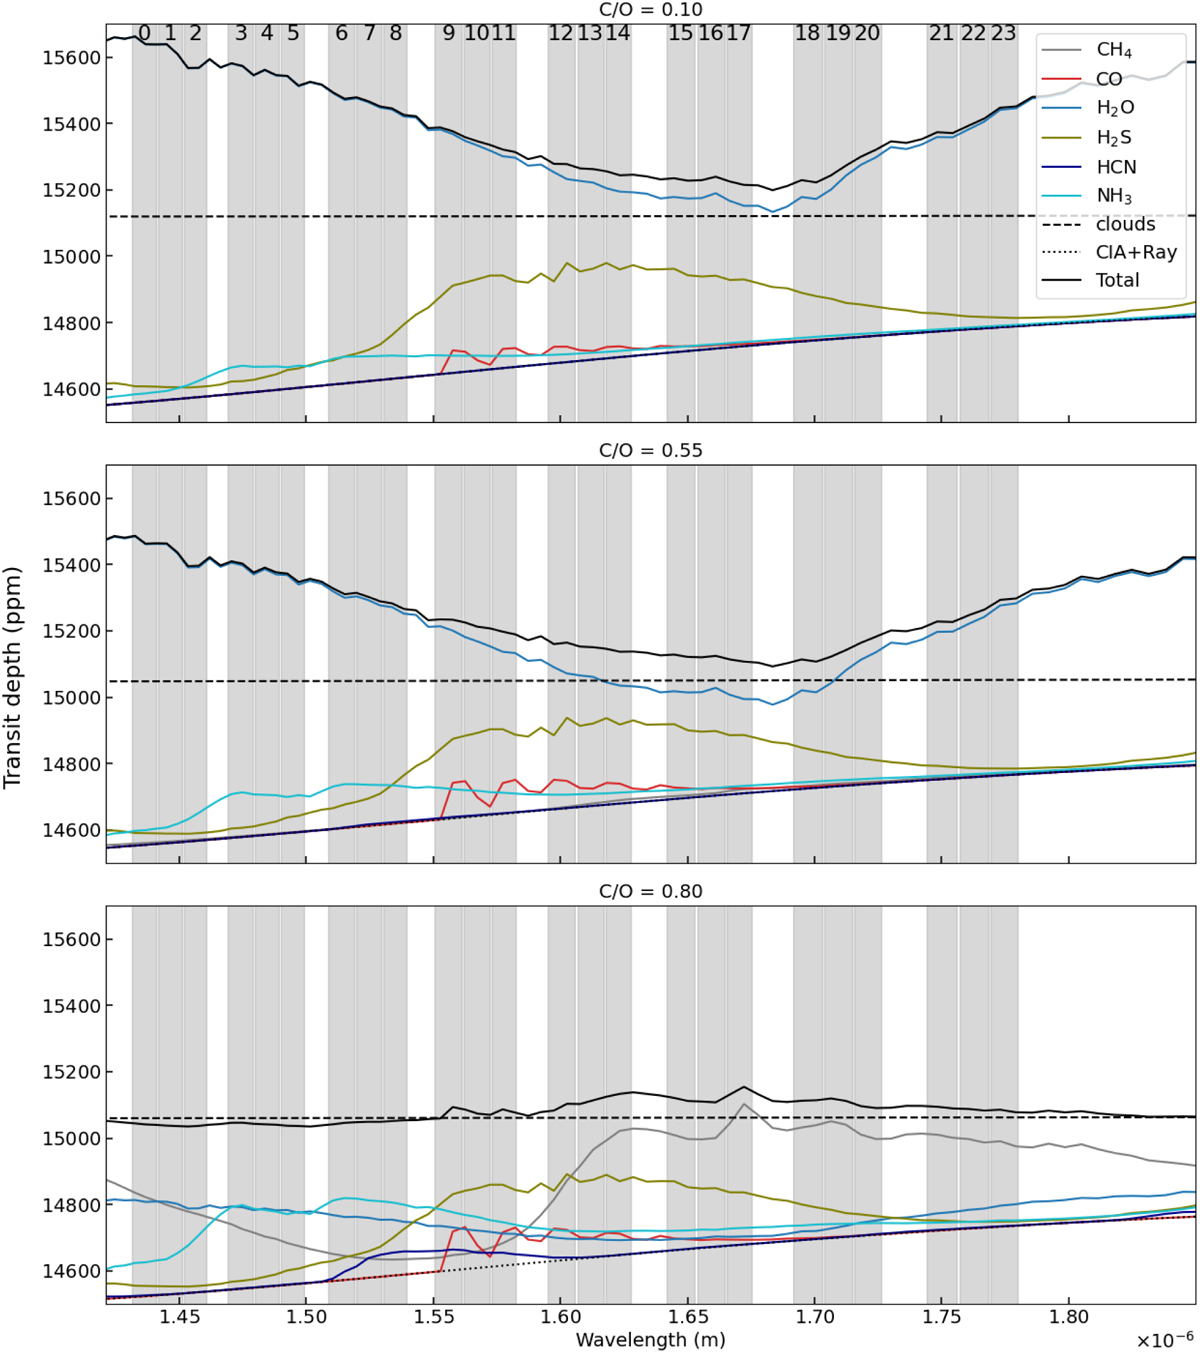
HD 209458 b low-resolution (ℛ ≈ 500) transit depth and species contributions simulated with Exo-REM. The grey areas represent the wavelength range of the CRIRES+ orders. On top are indicated the orders index number. From top to bottom: models with a C/O ratio of 0.1, 0.55, and 0.8, respectively. Dotted: the combined contributions of the H2−H2 and H2−He collision-induced absorptions and the effect of Rayleigh scattering. Dashed: the total contribution of the SiO2, Mg2SiO3 and Fe clouds for a cloud coverage of 1.0. The contributions of CO2, FeH, K, Na, PH3, TiO and VO were negligible in this spectral region and thus are not represented.
Current usage metrics show cumulative count of Article Views (full-text article views including HTML views, PDF and ePub downloads, according to the available data) and Abstracts Views on Vision4Press platform.
Data correspond to usage on the plateform after 2015. The current usage metrics is available 48-96 hours after online publication and is updated daily on week days.
Initial download of the metrics may take a while.