Fig. 9.
Download original image
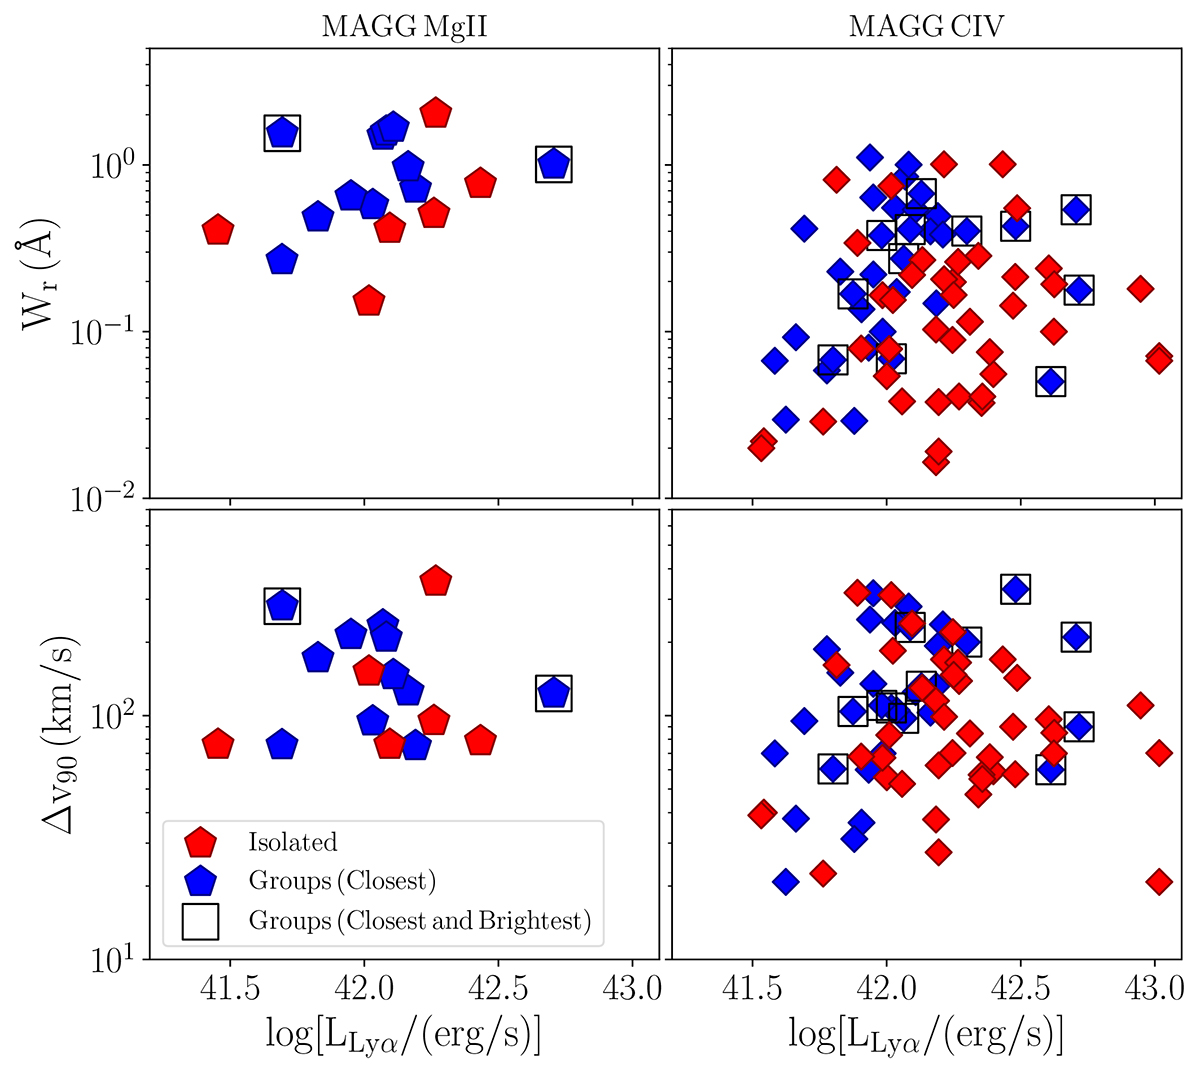
Mg II (left panels) and C IV (right panels) absorbers’ rest-frame equivalent width (top panels) and width in velocity space (bottom panels) as a function of the Lyα luminosity for isolated galaxies (red) and the closest member of each group (blue). Empty squares mark the case in which the closest galaxy of a group is also the brightest. The results from the Spearman rank test to assess the presence and the significance of possible correlations are listed in Table 2.
Current usage metrics show cumulative count of Article Views (full-text article views including HTML views, PDF and ePub downloads, according to the available data) and Abstracts Views on Vision4Press platform.
Data correspond to usage on the plateform after 2015. The current usage metrics is available 48-96 hours after online publication and is updated daily on week days.
Initial download of the metrics may take a while.