Fig. 6.
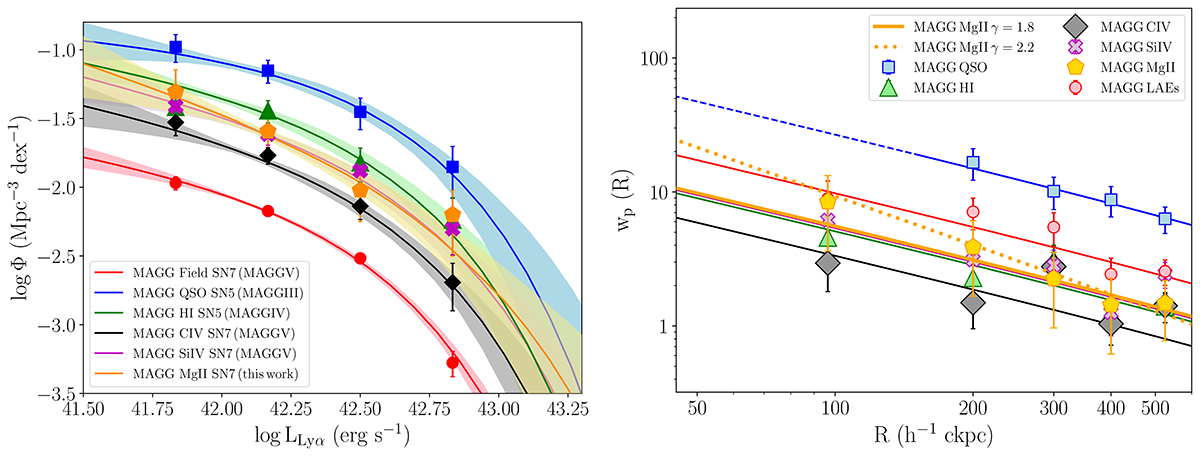
Download original image
Clustering of the absorbers around LAEs. Left panel: LAE luminosity function within |Δv|≤500 km s−1 of the Mg II absorbers (orange) compared to the field control sample (red, MAGG V) and to the results for LAEs around other tracers studied in MAGG (high-column density hydrogen absorbers in green from MAGG IV, C IV, and Si IV systems in black and purple from MAGG V and quasars in blue from Fossati et al. 2021). We show the parametric (line) and nonparametric (data points) estimates for each sample. Right panel: Projected cross-correlation function for LAEs within |Δv|≤500 km s−1 of the Mg II absorbers (orange) assuming γ = 1.8 (solid line) and γ = 2.2 (dotted line). The other populations explored in MAGG are shown with the same colors adopted in the left panel, while the LAEs auto-correlation function derived in MAGG V is shown in red. Vertical error bars are derived by bootstrapping the redshift of the Mg II absorbers over 1000 iterations.
Current usage metrics show cumulative count of Article Views (full-text article views including HTML views, PDF and ePub downloads, according to the available data) and Abstracts Views on Vision4Press platform.
Data correspond to usage on the plateform after 2015. The current usage metrics is available 48-96 hours after online publication and is updated daily on week days.
Initial download of the metrics may take a while.