Fig. 4.
Download original image
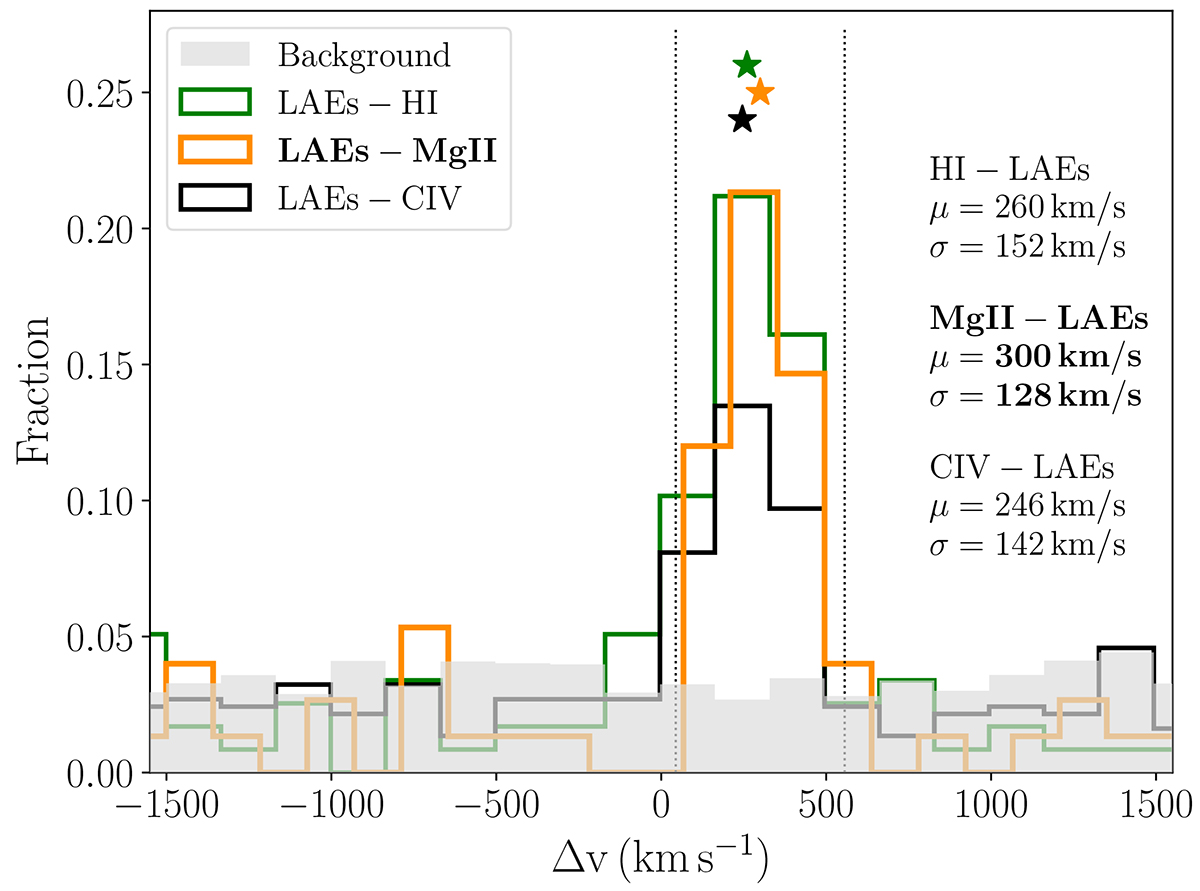
Distribution of LAEs within |Δv|≤1500 km s−1 of Mg II systems (orange) as a function of the line-of-sight separation. As a comparison, we also show the LAEs connected to C IV absorbers from MAGG V (black), those associated to strong H I absorbers from MAGG IV (green) and the distribution of a random sample representative of our expectations for the field (gray). The annotations show the best fit of the distributions considering a Gaussian function plus a background term, with the peaks shown as stars. The vertical dotted lines mark the 2σ interval around the peak, μ, of the Mg II-LAEs distribution, where the largest excess of galaxies is found.
Current usage metrics show cumulative count of Article Views (full-text article views including HTML views, PDF and ePub downloads, according to the available data) and Abstracts Views on Vision4Press platform.
Data correspond to usage on the plateform after 2015. The current usage metrics is available 48-96 hours after online publication and is updated daily on week days.
Initial download of the metrics may take a while.