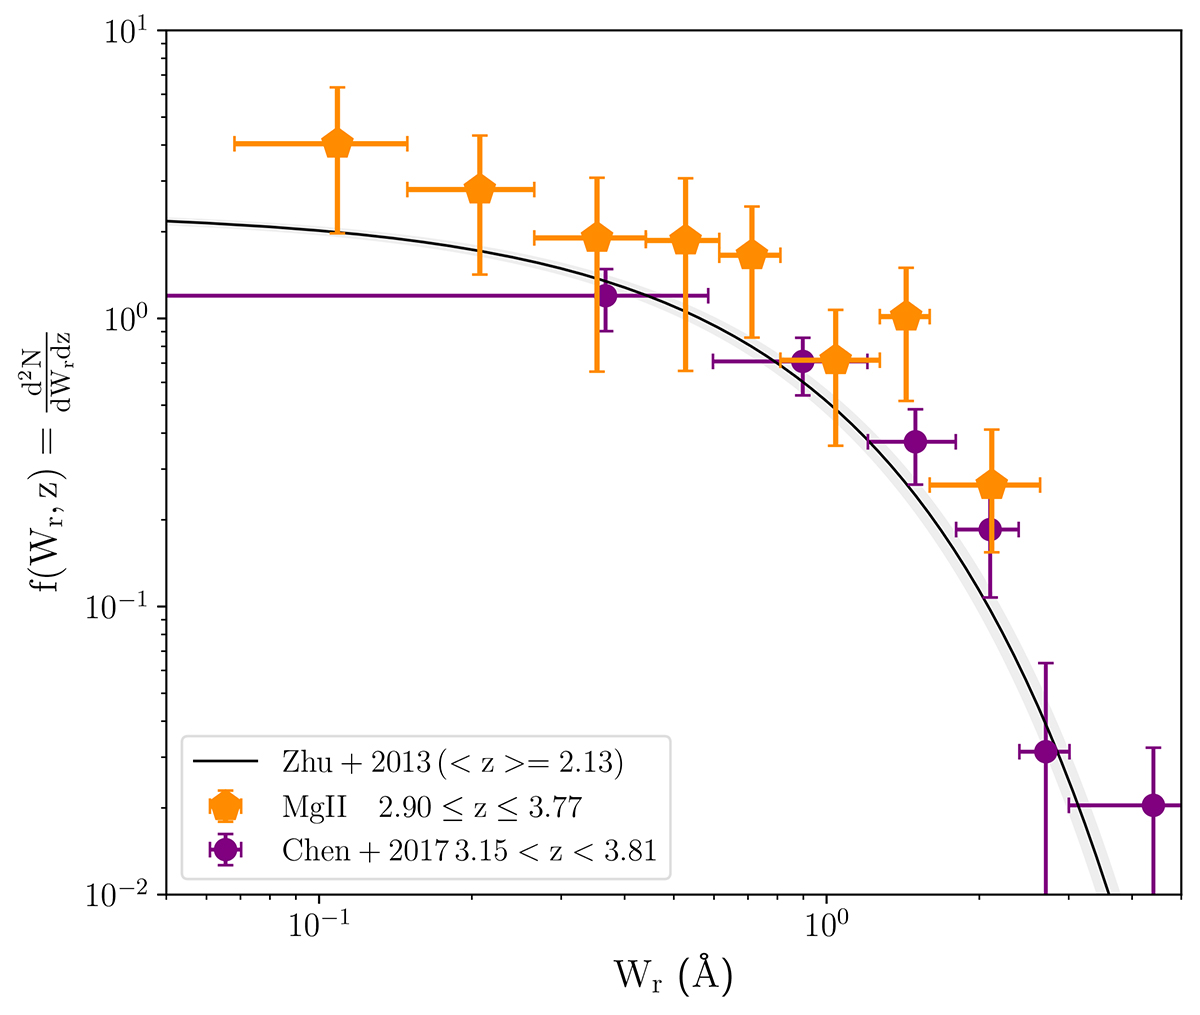
Fig. 2.
Download original image
Equivalent width distribution function per unit redshift of the MAGG Mg II absorption line systems (orange pentagons). The 10th and 90th percentiles from the bootstrap resampling and the width of each bin of equivalent width are shown as vertical and horizontal error bars, respectively. The results for the MAGG sample are consistent with the completeness-corrected functions from Zhu & Ménard (2013) (black solid line) and Chen et al. (2017) (purple dots) down to Wr ≈ 0.1 Å.
Current usage metrics show cumulative count of Article Views (full-text article views including HTML views, PDF and ePub downloads, according to the available data) and Abstracts Views on Vision4Press platform.
Data correspond to usage on the plateform after 2015. The current usage metrics is available 48-96 hours after online publication and is updated daily on week days.
Initial download of the metrics may take a while.