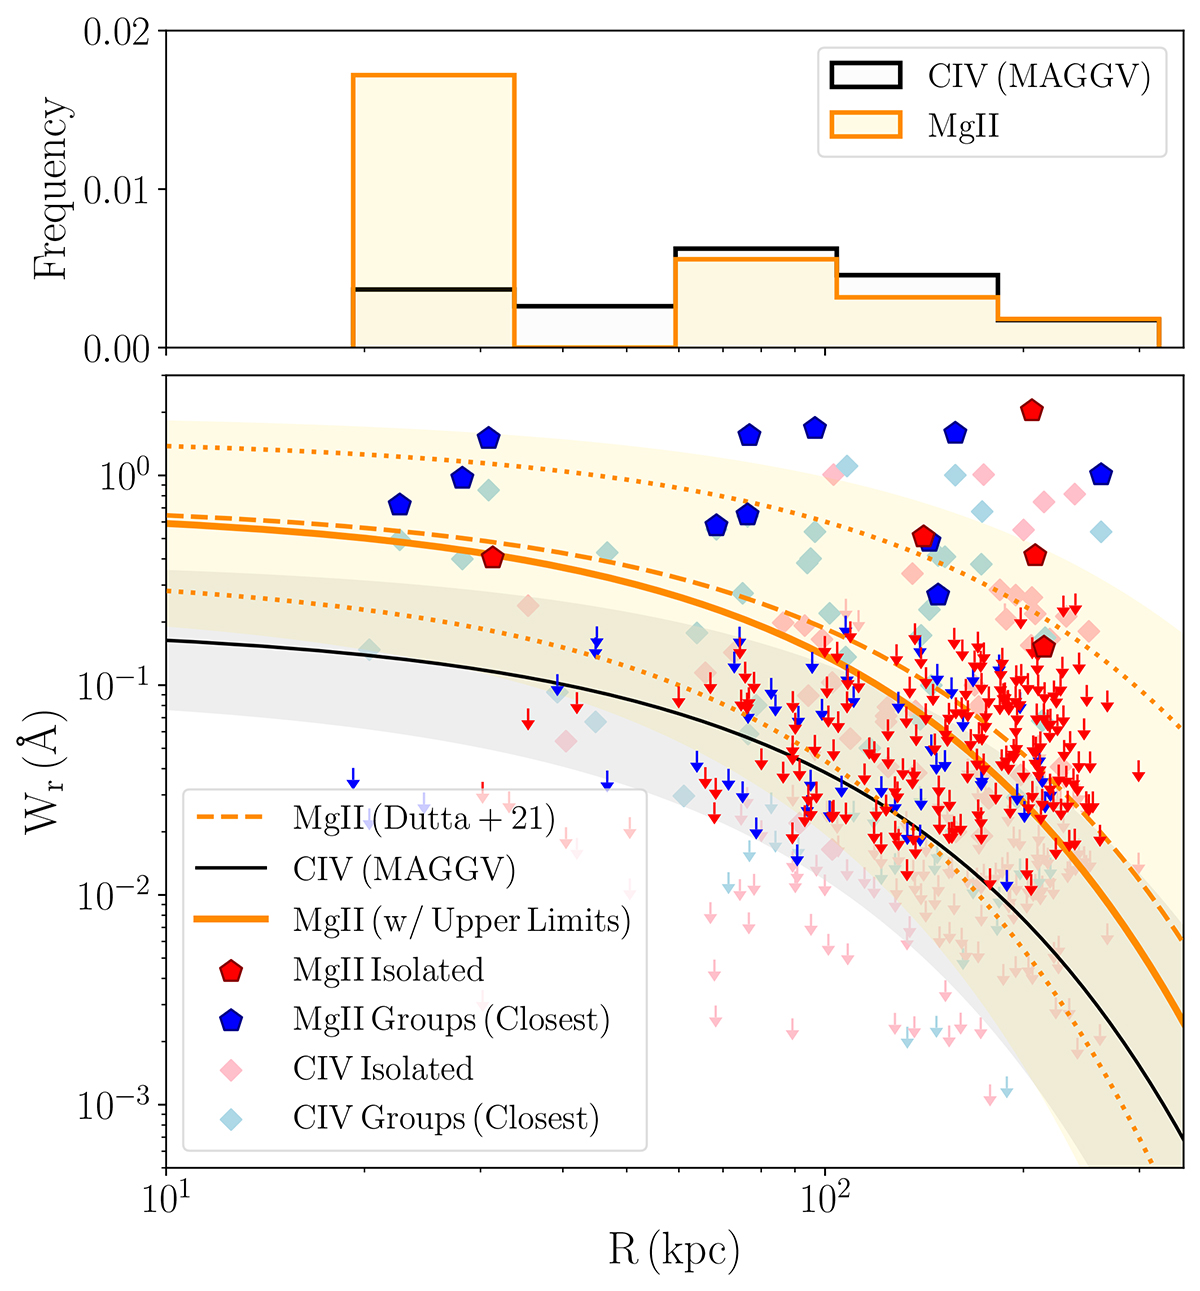
Fig. 12.
Download original image
Radial profiles of the Mg II and C IV equivalent width. Upper panel: Impact parameter distribution of LAEs around Mg II (orange) and C IV (black) absorbers. Only the member closest to the line of sight is considered for each group. Lower panel: Rest-frame equivalent width of the Mg II and C IV absorbers around the group (closest member, blue and light blue, respectively) and isolated LAEs (red and pink), as a function of the galaxies’ projected separation. Arrows mark 3σ upper limits where no absorption systems are detected around LAEs. The best log-linear models fitted to the data and the upper limits are shown as solid lines, while the shaded area marks the 1σ uncertainties. As a comparison, we show the Mg II best-fit log-linear model at z ≲ 2 from Dutta et al. (2021) (dashed orange line).
Current usage metrics show cumulative count of Article Views (full-text article views including HTML views, PDF and ePub downloads, according to the available data) and Abstracts Views on Vision4Press platform.
Data correspond to usage on the plateform after 2015. The current usage metrics is available 48-96 hours after online publication and is updated daily on week days.
Initial download of the metrics may take a while.