Fig. 10.
Download original image
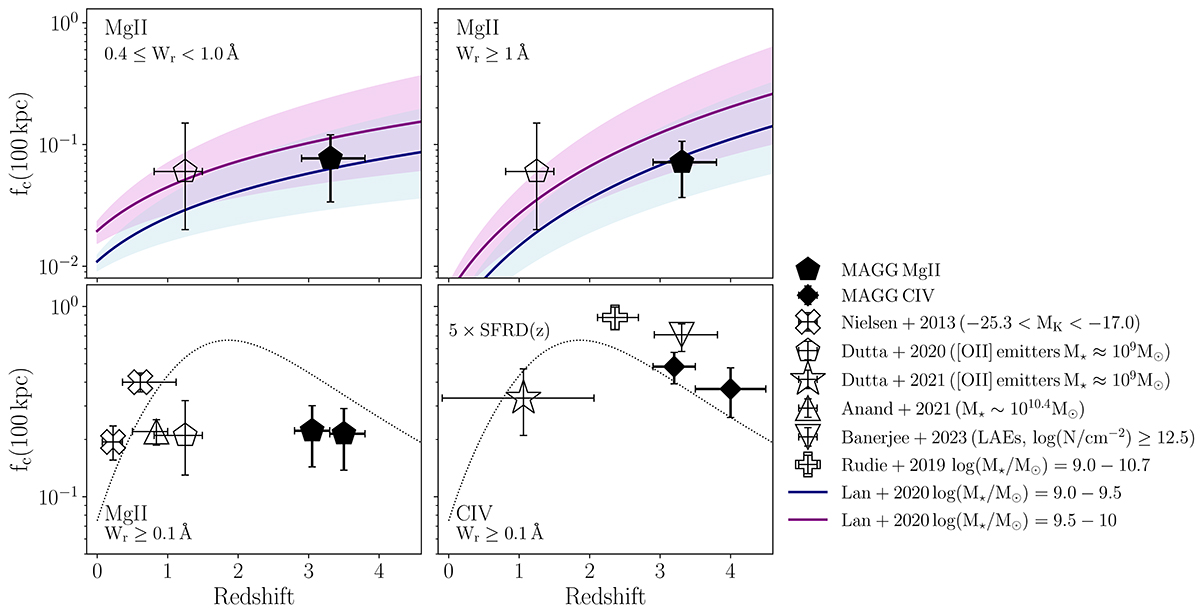
Mg II and C IV cumulative covering fraction within R < 100 kpc. Upper panels: The results for strong (Wr ≥ 1 Å, left panel) and weak (0.4 ≤ Wr < 1.0 Å, right panel) Mg II absorbers observed around LAEs in MAGG (black) are consistent with the redshift evolution model calibrated at z ≲ 1.3 by Lan (2020) for star-forming galaxies with stellar mass log(M⋆/M⊙) = 9.0 − 9.5 and log(M⋆/M⊙) = 9.5 − 10. Also shown is the covering fraction of Mg II gas observed around [O III] emitters by Dutta et al. (2020) at z ≈ 1. Lower panels: Results for Wr ≥ 0.1 Å Mg II (right panel, black pentagon) and C IV (left panel, black diamond) samples, without any distinctions between weak and stronger absorbers. Also shown are the results from Nielsen et al. (2013) (crosses), Dutta et al. (2020) (pentagon) and Anand et al. (2021) (up triangle, Wr ≥ 0.4 Å), Dutta et al. (2021) (star), Rudie et al. (2019) (cross, log(N/cm−2)≥13.0) corresponding to Wr ≳ 0.04 Å in linear regime), and Banerjee et al. (2023) (down triangle, log(N/cm−2)≥12.5) corresponding to Wr ≳ 0.01 Å). Horizontal error bars mark the explored redshift range. The evolution of the C IV covering fraction is consistent with the star formation rate density as parametrized by Madau & Dickinson (2014) (dotted line, arbitrary normalization).
Current usage metrics show cumulative count of Article Views (full-text article views including HTML views, PDF and ePub downloads, according to the available data) and Abstracts Views on Vision4Press platform.
Data correspond to usage on the plateform after 2015. The current usage metrics is available 48-96 hours after online publication and is updated daily on week days.
Initial download of the metrics may take a while.