Fig. 7.
Download original image
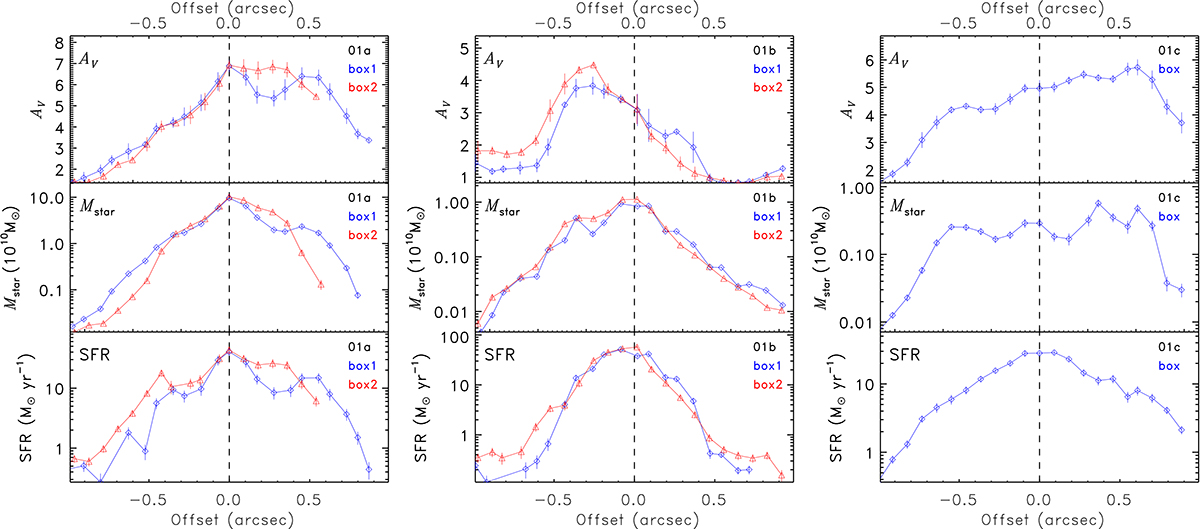
Physical parameters in the boxes shown in Fig. 3. Columns show the three galaxies as labeled, and rows from top to bottom show mean AV, Mstar, and instantaneous SFR. The parameters were derived from the resolved maps in bins of 2–3 pixels within 0![]() 21 wide boxes spanning 2″, crossing the center and sampling the most dramatic color gradients across the whole galaxy. The abscissa shows the distance of each bin from the galaxy center, indicated by the dashed vertical line, from southeast to northwest. For 01a and 01b, the two boxes with different orientations are indicated by blue diamonds and a blue line for box1 and red triangles and a red line for box2. (One box sufficed for 01c.)
21 wide boxes spanning 2″, crossing the center and sampling the most dramatic color gradients across the whole galaxy. The abscissa shows the distance of each bin from the galaxy center, indicated by the dashed vertical line, from southeast to northwest. For 01a and 01b, the two boxes with different orientations are indicated by blue diamonds and a blue line for box1 and red triangles and a red line for box2. (One box sufficed for 01c.)
Current usage metrics show cumulative count of Article Views (full-text article views including HTML views, PDF and ePub downloads, according to the available data) and Abstracts Views on Vision4Press platform.
Data correspond to usage on the plateform after 2015. The current usage metrics is available 48-96 hours after online publication and is updated daily on week days.
Initial download of the metrics may take a while.