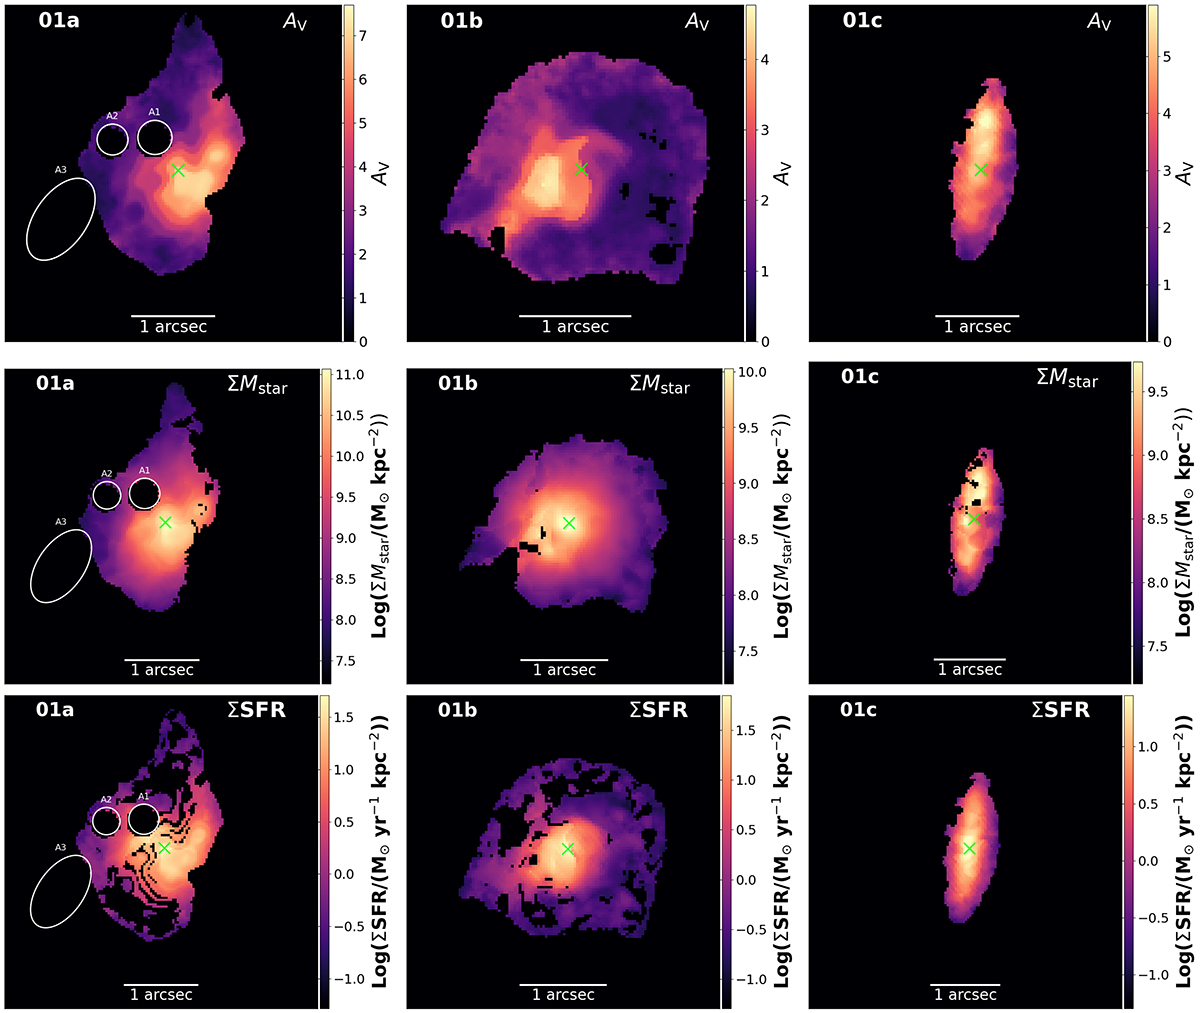
Fig. 6.
Download original image
Pixel-based maps of CIGALE bestfit parameters. Panels from top to bottom show AV, stellar mass surface density, and instantaneous SFR surface density. From left to right, columns show source 01a, 01b, and 01c. In all maps north is up and east to the left, and a scale bar shows 1″ or ∼8 pkpc. The green cross marks the galaxy center. Only pixels with parameters measured at > 2σ are shown in the AV and ΣMstar maps, and at > 1σ significance in the ΣSFR maps. This is because the SFRs are poorly constrained when the SEDs do not extend to long wavelengths (50 μm–3 mm), where dust emits. The white circles and ellipses in the left panel represent regions masking distinct galaxies from 01a.
Current usage metrics show cumulative count of Article Views (full-text article views including HTML views, PDF and ePub downloads, according to the available data) and Abstracts Views on Vision4Press platform.
Data correspond to usage on the plateform after 2015. The current usage metrics is available 48-96 hours after online publication and is updated daily on week days.
Initial download of the metrics may take a while.