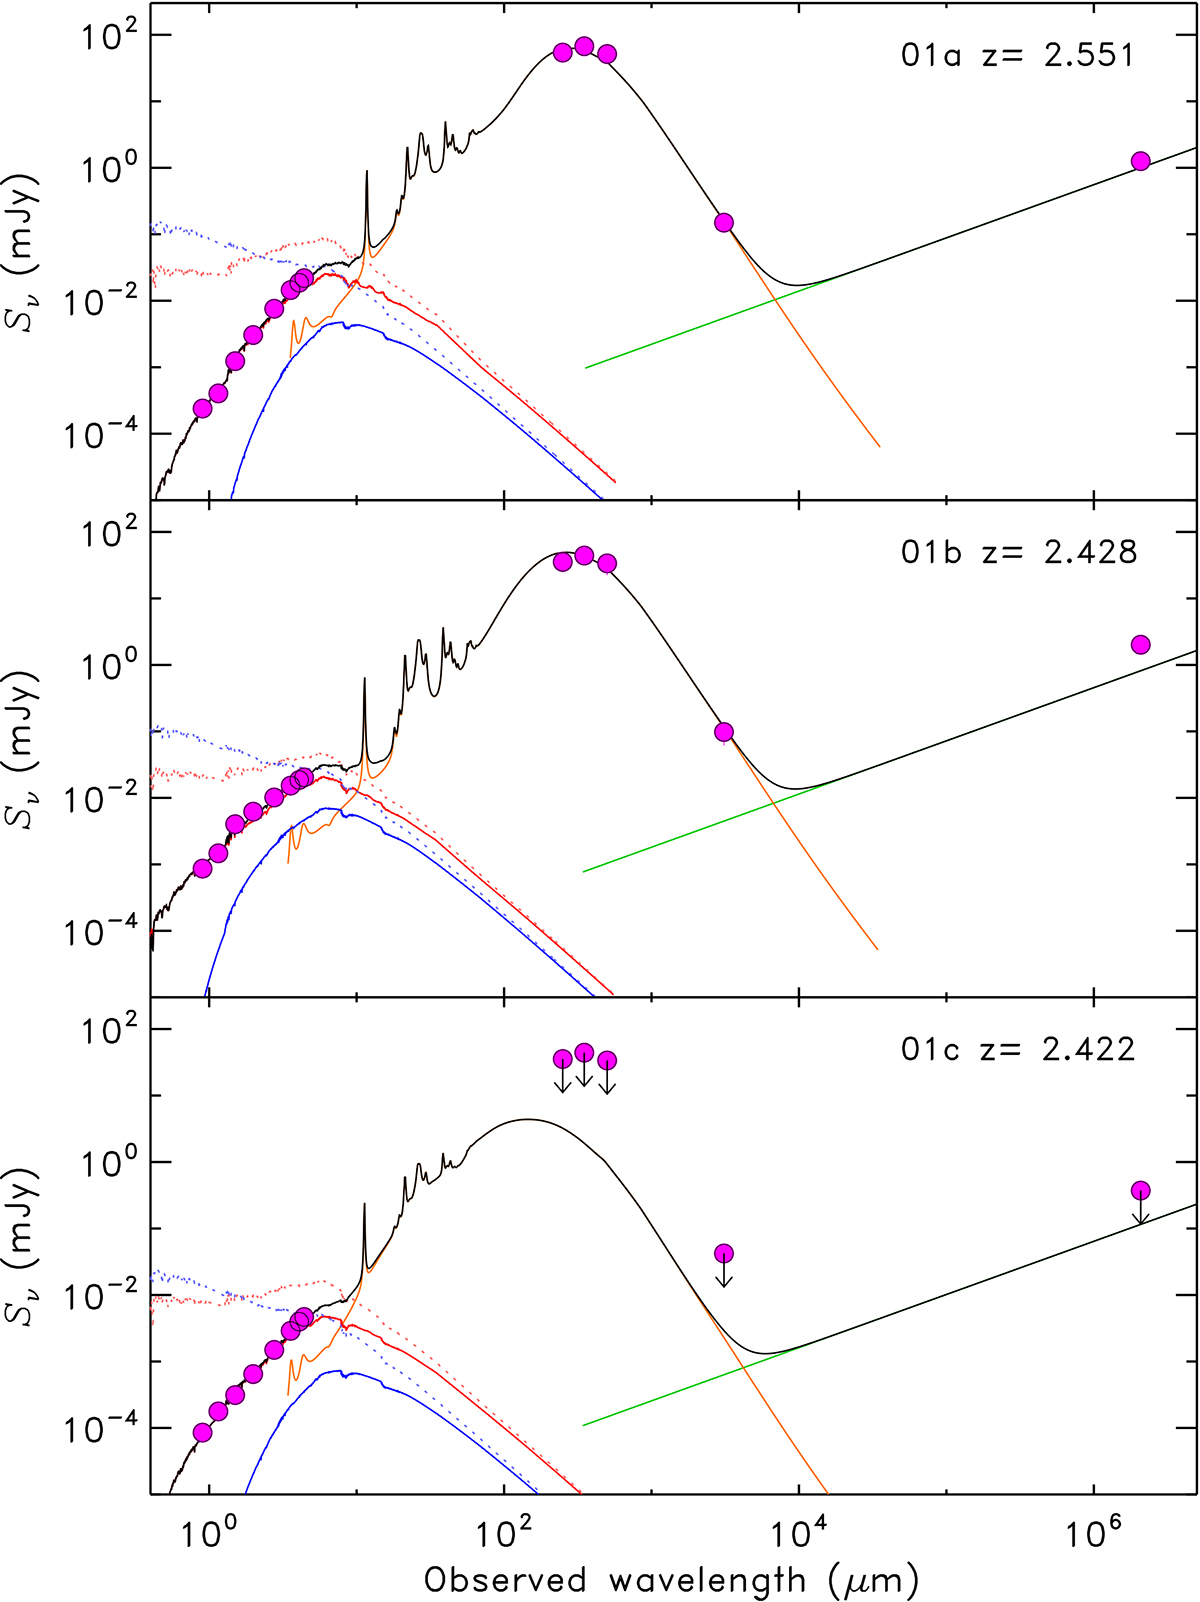
Fig. 5.
Download original image
SEDs of three CO emitters (filled magenta circles): 01a (top panel), 01b (middle panel), and 01c (bottom panel). Downward arrows represent 5σ upper limits. The CIGALE bestfit model is shown with a solid black line. Dotted lines show the stellar light (red for the older population and blue for the younger) before dust attenuation, and the solid red and blue lines show the attenuated stellar light. The orange line shows the dust component, and the green line shows the radio synchrotron emission.
Current usage metrics show cumulative count of Article Views (full-text article views including HTML views, PDF and ePub downloads, according to the available data) and Abstracts Views on Vision4Press platform.
Data correspond to usage on the plateform after 2015. The current usage metrics is available 48-96 hours after online publication and is updated daily on week days.
Initial download of the metrics may take a while.