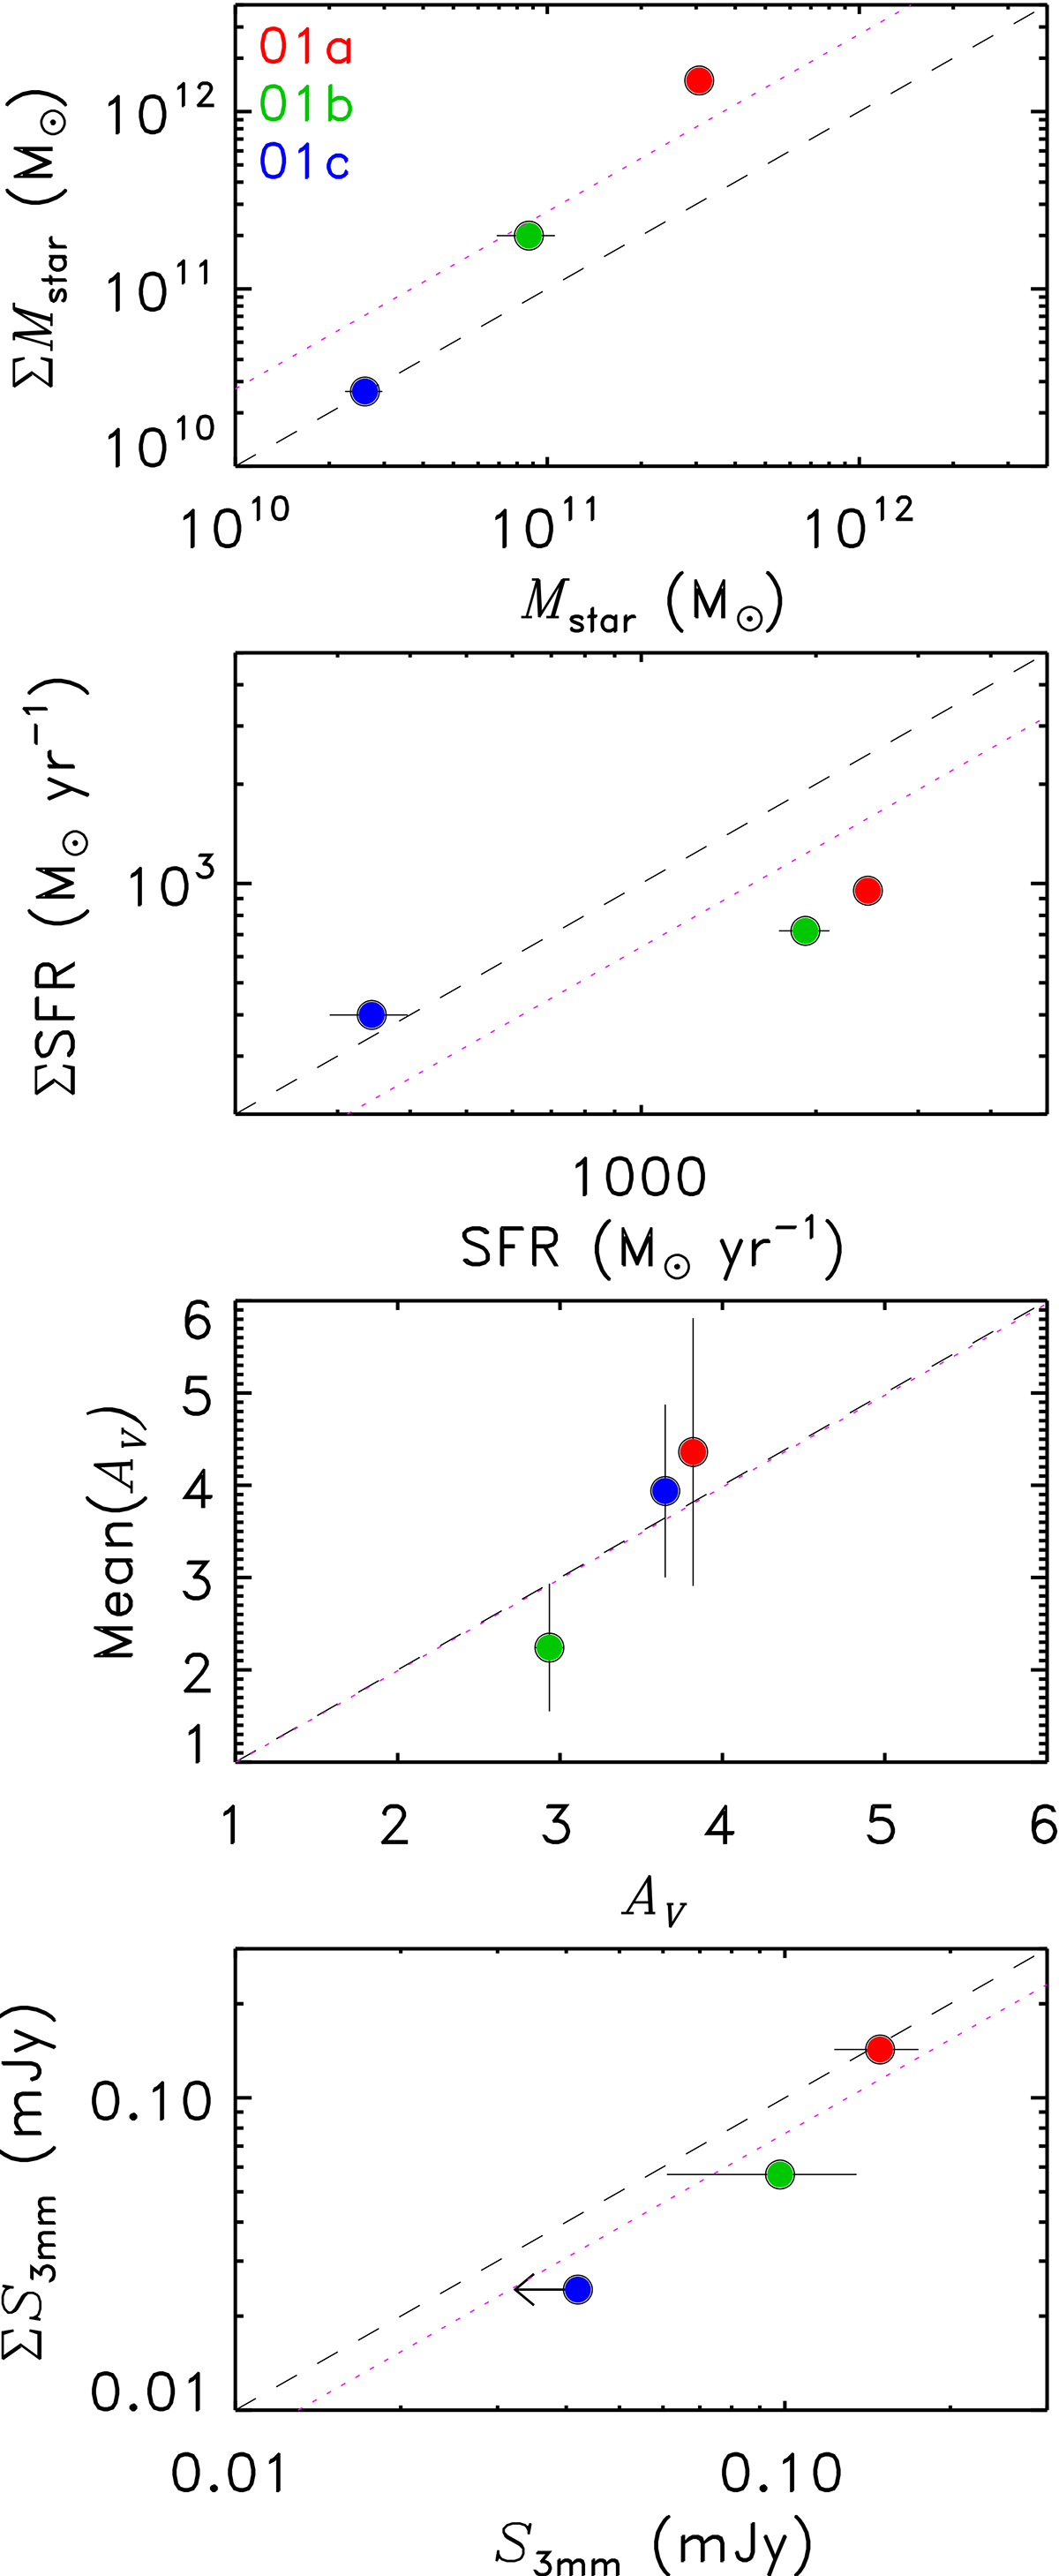
Fig. B.1.
Download original image
Comparison between the sum of the resolved parameters and the parameters derived from fitting the integrated SEDs. Filled red, green, and blue points represent, respectively, sources 01a, 01b, and 01c. The panels show, from top to bottom, the stellar mass, the instantaneous SFR, the extinction, and the 3 mm flux density. The parameter mean(AV) is the weighted mean of the pixel-derived values. The left-pointing arrows represent 5σ upper limits (Table 3). The dashed black line shows the 1:1 relation, and the dotted magenta line the average ratio for the three galaxies (2.7, 0.6, 1.0, and 0.8 from top to bottom). The resolved sums include only pixels with a value above 1–2σ as was done in building the resolved maps shown in Fig. 6.
Current usage metrics show cumulative count of Article Views (full-text article views including HTML views, PDF and ePub downloads, according to the available data) and Abstracts Views on Vision4Press platform.
Data correspond to usage on the plateform after 2015. The current usage metrics is available 48-96 hours after online publication and is updated daily on week days.
Initial download of the metrics may take a while.