Fig. 18.
Download original image
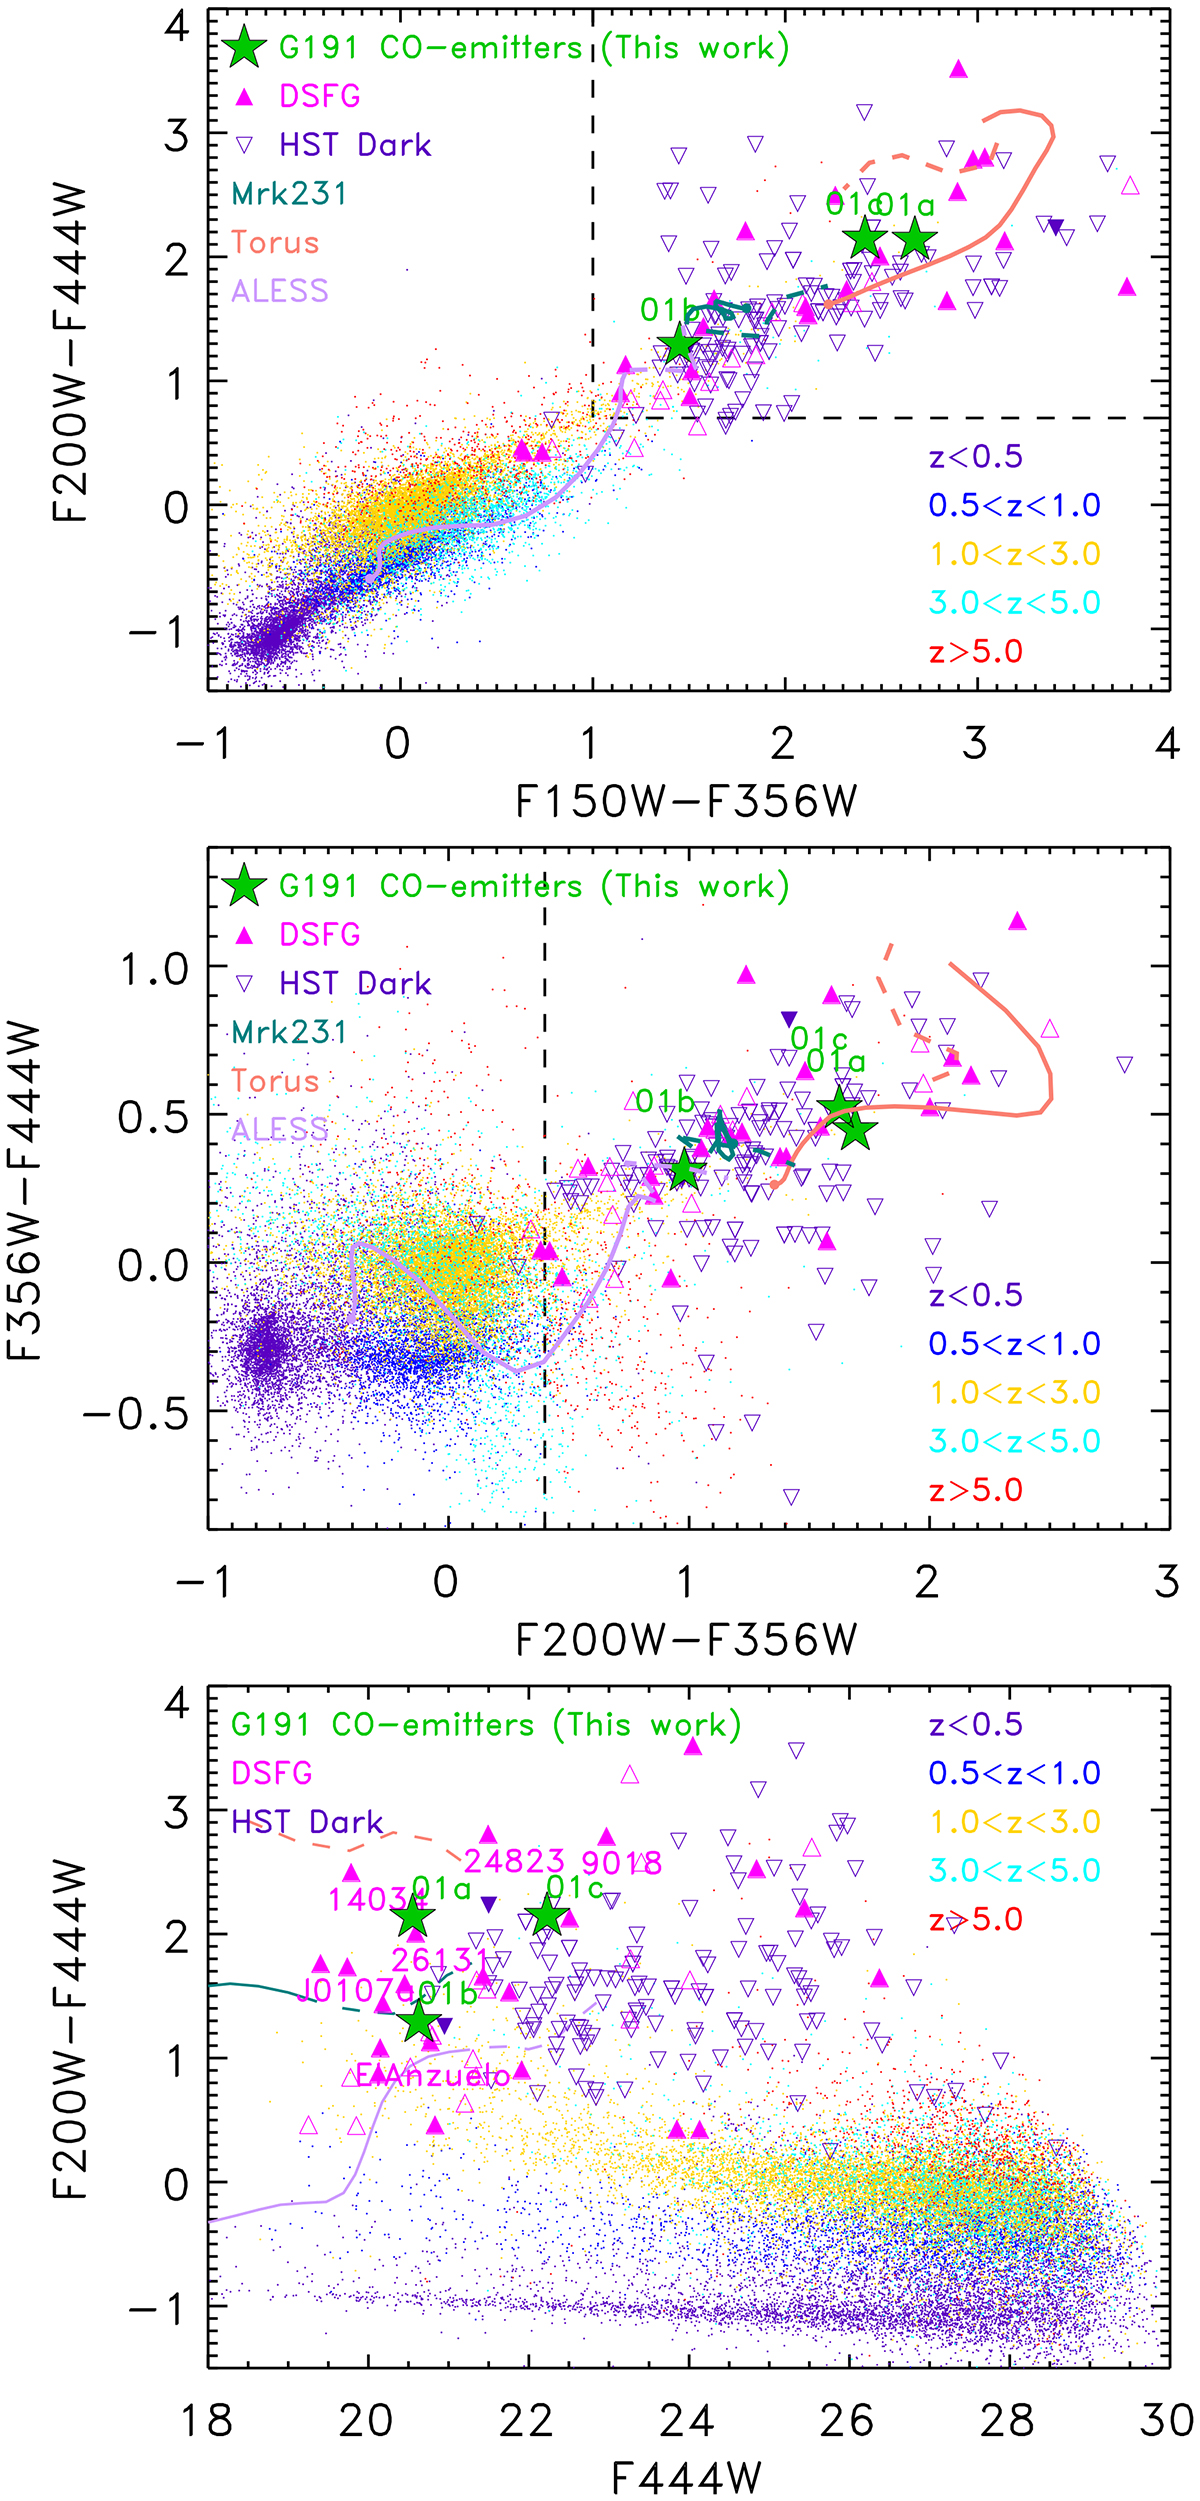
JWST color–color and color–magnitude diagrams for a variety of galaxies. Filled green stars represent the three CO targets. Small dots represent galaxies from the UNCOVER program (Wang et al. 2024b) with their colors indicating the photometric redshift: purple for z < 0.5, blue for 0.5 < z < 1.0, yellow for 1.0 < z < 3.0, cyan for 3.0 < z < 5.0, and red for z > 5. Other symbols represent HST-dark galaxies (purple upside-down triangles; Barro et al. 2024; Nelson et al. 2023; Barrufet et al. 2023; Pérez-González et al. 2023; Frye et al. 2023; Wang et al. 2024a) and DSFGs (magenta triangles; Peng et al. 2023; Zavala et al. 2023; Huang et al. 2023; Cheng et al. 2023; McKay et al. 2024; Smail et al. 2023; Kamieneski et al. 2023; Sun et al. 2024; Meyer et al. 2024). Filled symbols indicate sources with spectroscopic redshifts. Dashed lines mark the typical colors of JWST red sources. DSFGs with spectroscopic redshifts ∼2.5 are labeled in the bottom panel (i.e., El Anzuelo at z = 2.3; Kamieneski et al. 2023; J0107a at z = 2.467; Huang et al. 2023; and four galaxies at 2.1 < z < 2.7 from Price et al. 2023). The lilac, salmon, and teal curves show tracks for the average SED from the ALESS SMG sample (Danielson et al. 2017), the Torus template (Polletta et al. 2007), and Mrk 231, respectively, with the solid curve showing 0.1 < z < 2.5 and the dashed curve 2.5 < z < 5.
Current usage metrics show cumulative count of Article Views (full-text article views including HTML views, PDF and ePub downloads, according to the available data) and Abstracts Views on Vision4Press platform.
Data correspond to usage on the plateform after 2015. The current usage metrics is available 48-96 hours after online publication and is updated daily on week days.
Initial download of the metrics may take a while.