Fig. 17.
Download original image
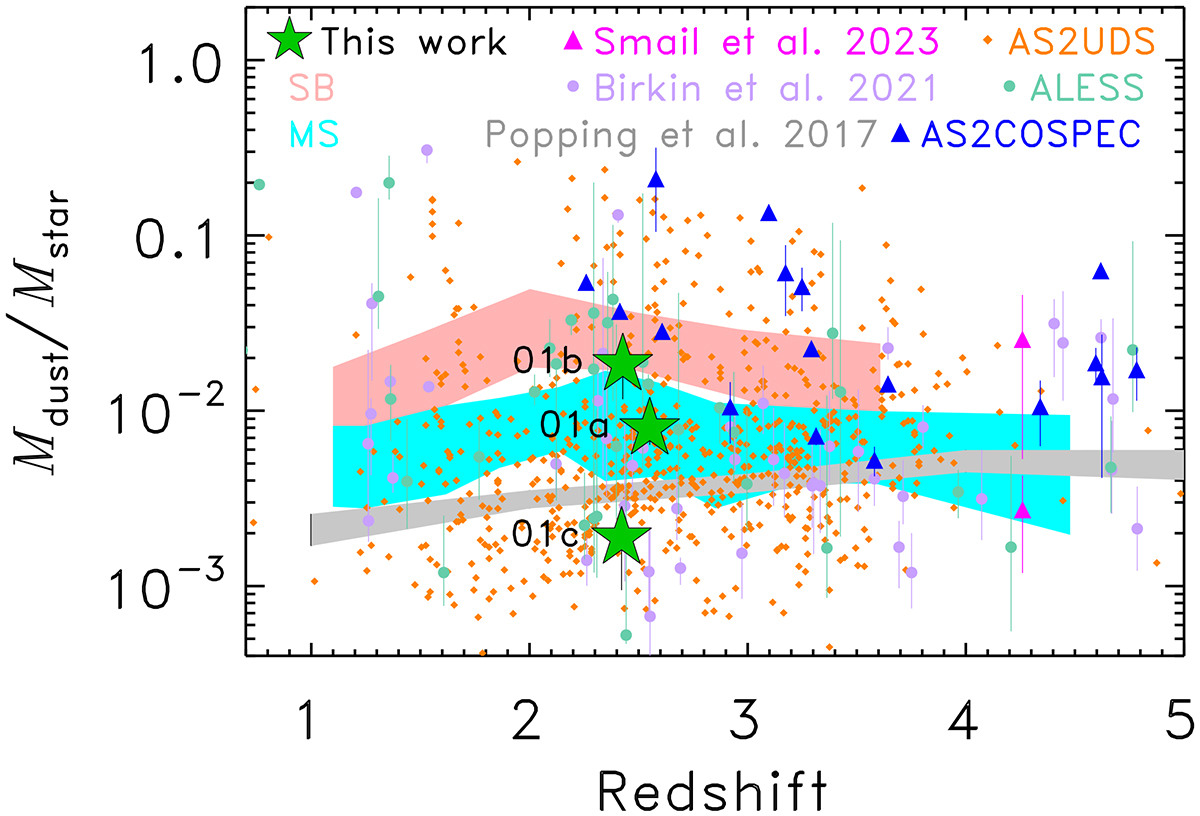
Mdust/Mstar versus redshift of our sources (green stars), and of various SMG samples from the literature AS2COSPEC (blue triangles; Liao et al. 2024), PEARLS SMGs in Abell 1489 (magenta triangles; Smail et al. 2023), AS2UDS (orange diamonds; Dudzevičiūtė et al. 2020), ALESS (teal circles; Danielson et al. 2017), and the ALMA SMGs from Birkin et al. (2021) (light purple circles). The average values and 68% probability ranges for main sequence (MS) and starburst (SB) dusty galaxies from the sample of DSFGs in Donevski et al. (2020) are shown as shaded cyan and salmon areas, respectively. The gray region represents the predicted DSRs for galaxies with log(Mstar/M⊙) = 10.5 − 11.5 from the fiducial model of Popping et al. (2017).
Current usage metrics show cumulative count of Article Views (full-text article views including HTML views, PDF and ePub downloads, according to the available data) and Abstracts Views on Vision4Press platform.
Data correspond to usage on the plateform after 2015. The current usage metrics is available 48-96 hours after online publication and is updated daily on week days.
Initial download of the metrics may take a while.