Fig. 7
Download original image
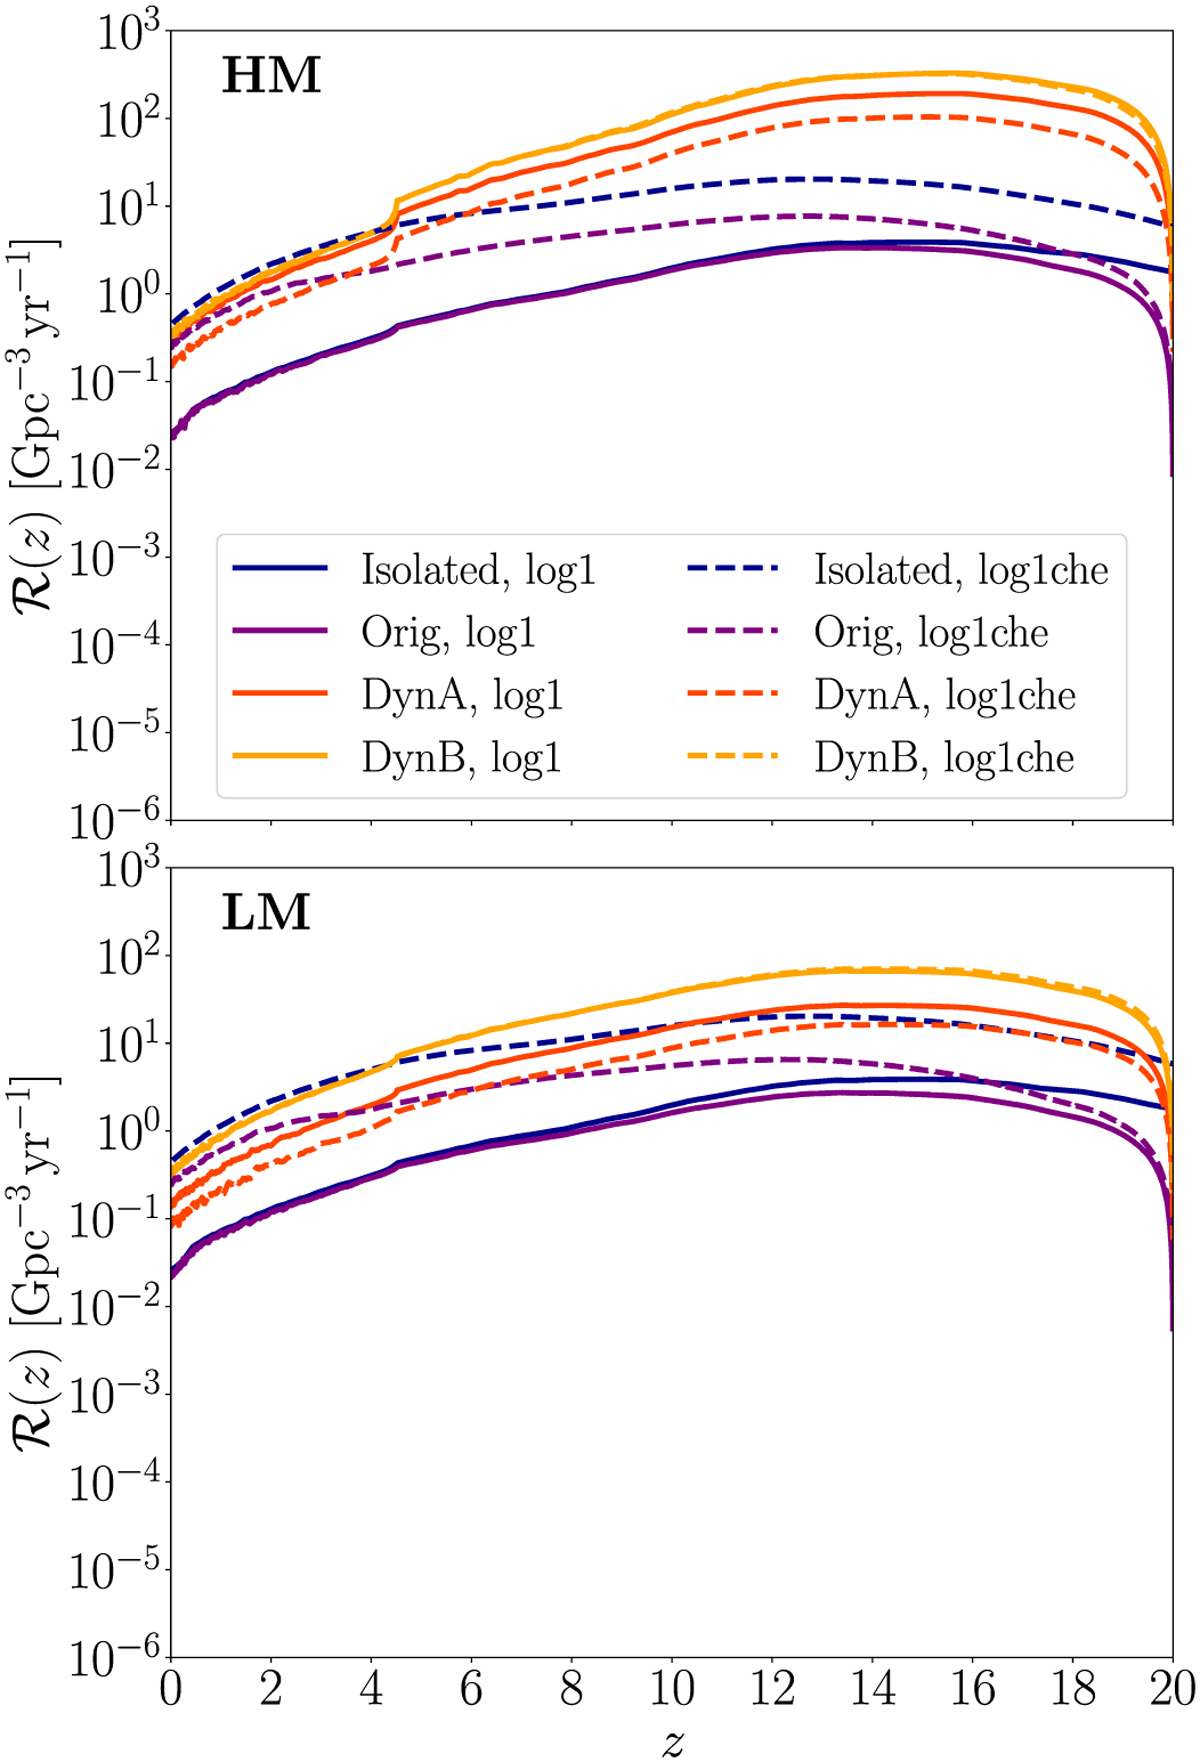
Merger rate density of Pop. III BBHs in star clusters. We assume that all of our clusters are disrupted at zmin = 10. We show both log1 (solid lines) and log1che (dashed lines). Isolated and original BBHs are shown in blue and purple, respectively. DynA and DynB BBHs are shown in red and orange, respectively. In the upper (lower) plot, we show the BBH merger rate density in HM (LM) clusters.
Current usage metrics show cumulative count of Article Views (full-text article views including HTML views, PDF and ePub downloads, according to the available data) and Abstracts Views on Vision4Press platform.
Data correspond to usage on the plateform after 2015. The current usage metrics is available 48-96 hours after online publication and is updated daily on week days.
Initial download of the metrics may take a while.