Fig. C.1
Download original image
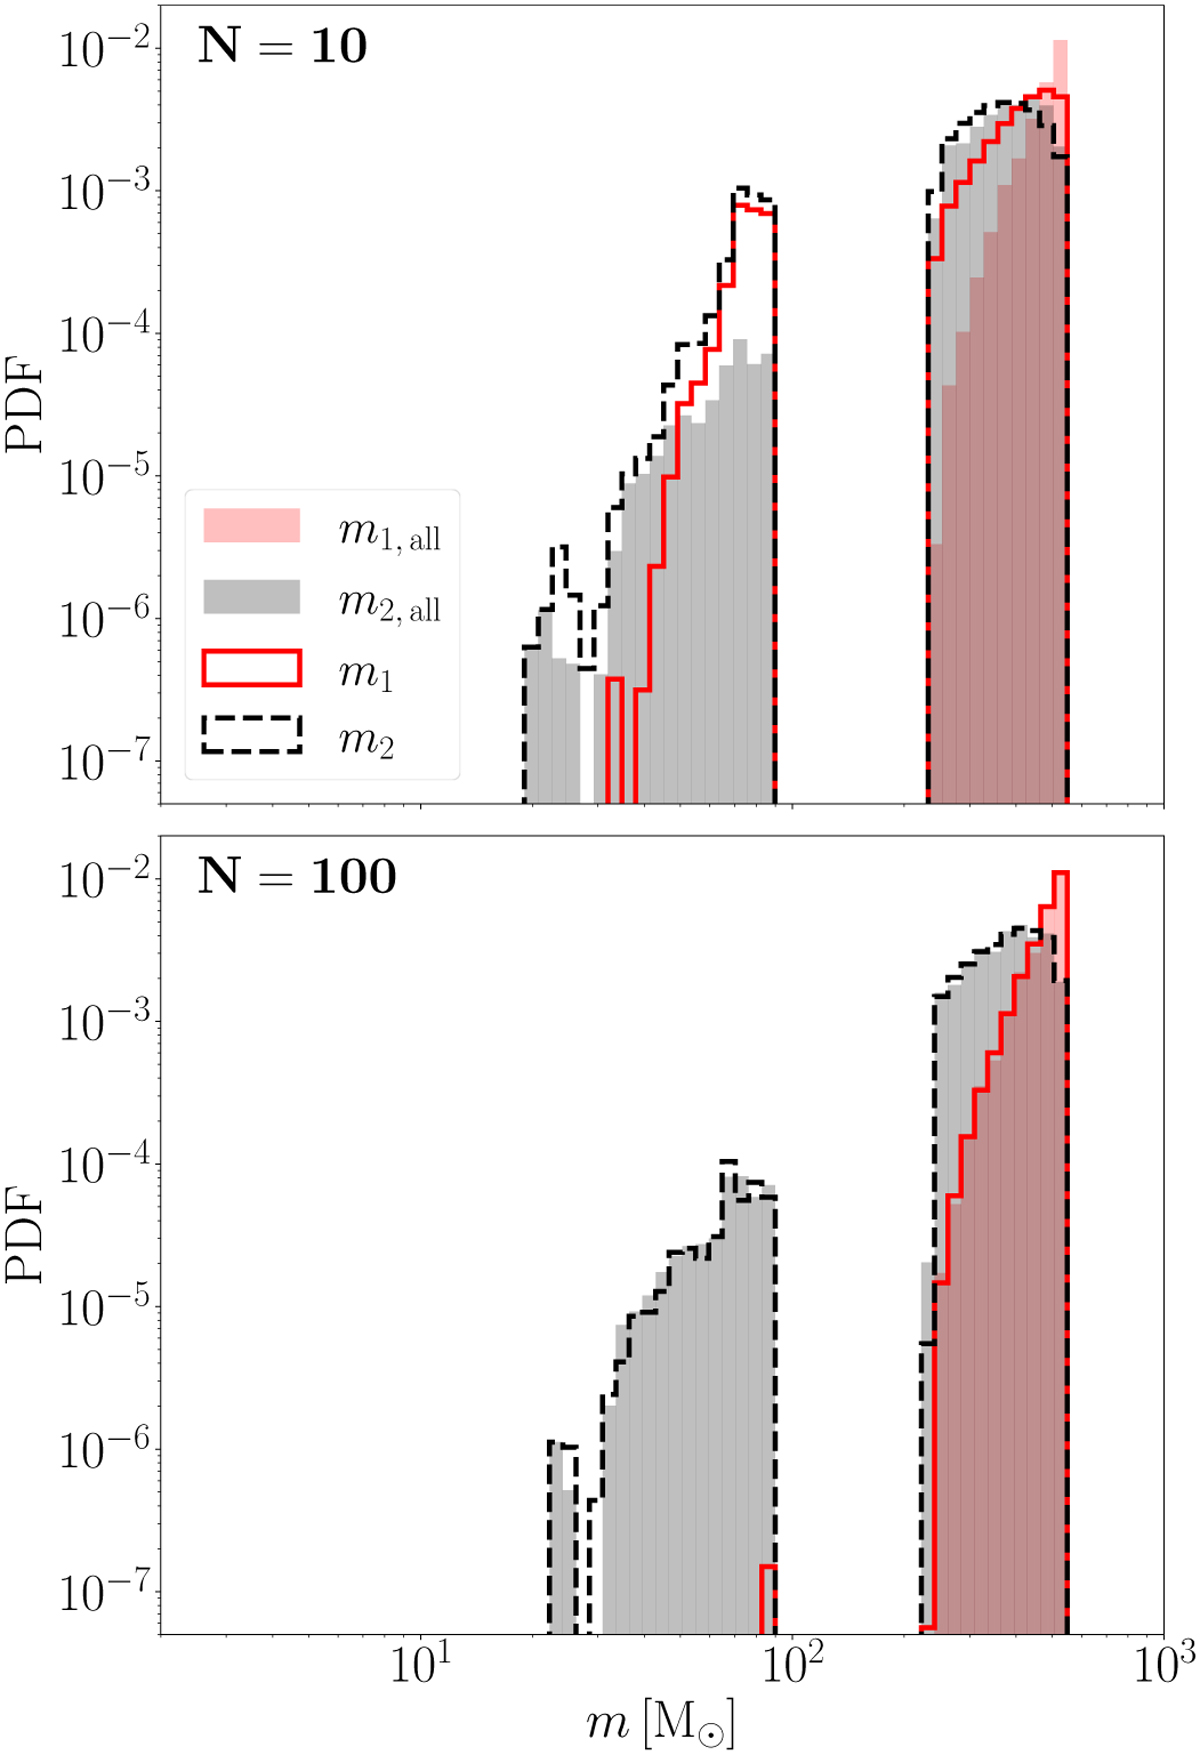
Distribution of m1 (red solid line) and m2 (black dashed line) for BBH mergers with model DynB in HM clusters. We obtain them considering, at each drawing, sub-samples of the SEVN catalog with size 10 (upper panel) and 100 (lower panel), respectively. The shaded areas show the distributions obtained when sampling the 1g BHs from the SEVN catalog without any restriction.
Current usage metrics show cumulative count of Article Views (full-text article views including HTML views, PDF and ePub downloads, according to the available data) and Abstracts Views on Vision4Press platform.
Data correspond to usage on the plateform after 2015. The current usage metrics is available 48-96 hours after online publication and is updated daily on week days.
Initial download of the metrics may take a while.