Fig. 1
Download original image
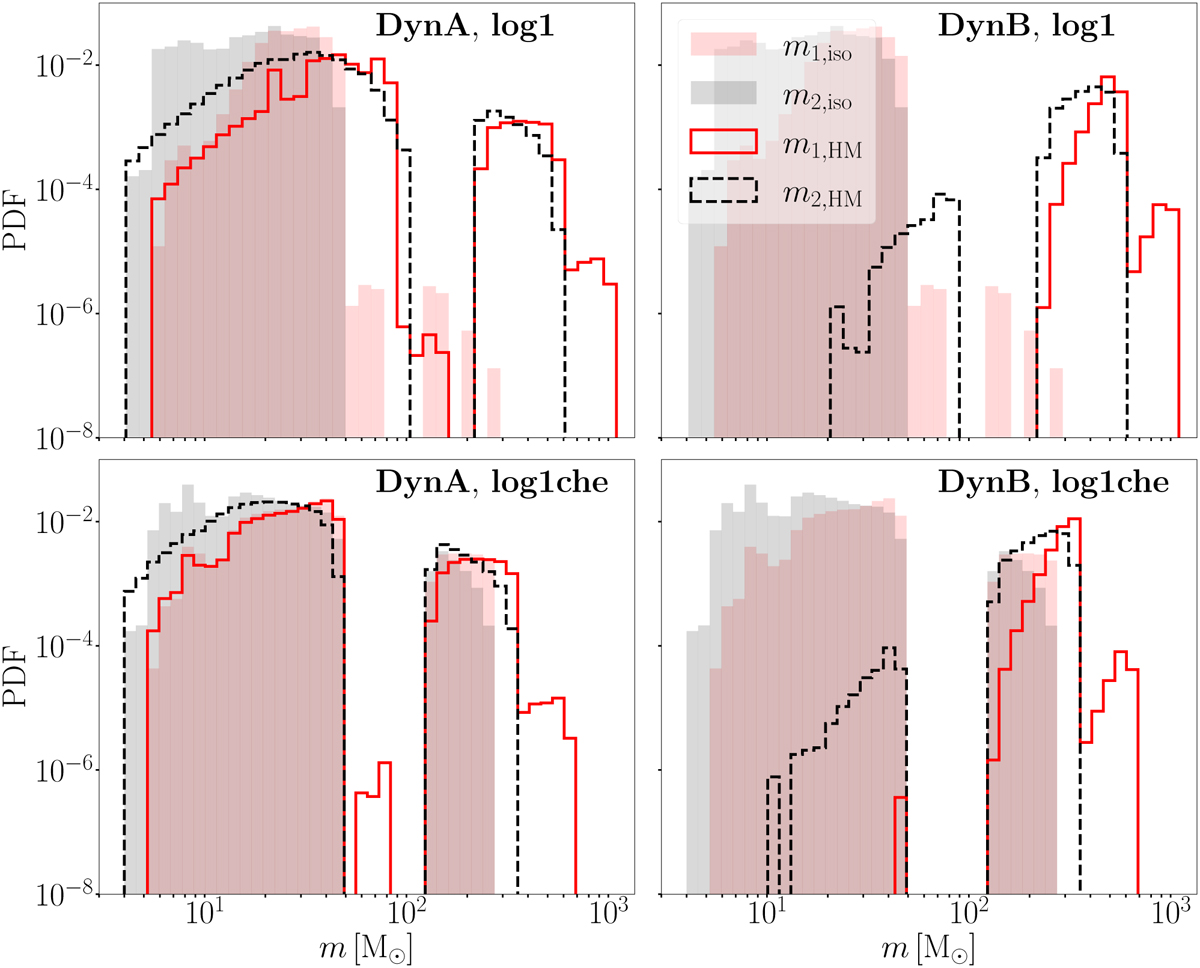
Distributions of primary (red) and secondary (black) masses of BBHs merging in HM clusters for log1 (upper panels) and log1che (lower panels). The shaded histograms show the results found by Costa et al. (2023) for isolated BBHs. The left column shows the results found with the pairing function DynA, and the right column shows the results with DynB.
Current usage metrics show cumulative count of Article Views (full-text article views including HTML views, PDF and ePub downloads, according to the available data) and Abstracts Views on Vision4Press platform.
Data correspond to usage on the plateform after 2015. The current usage metrics is available 48-96 hours after online publication and is updated daily on week days.
Initial download of the metrics may take a while.