Fig. 2.
Download original image
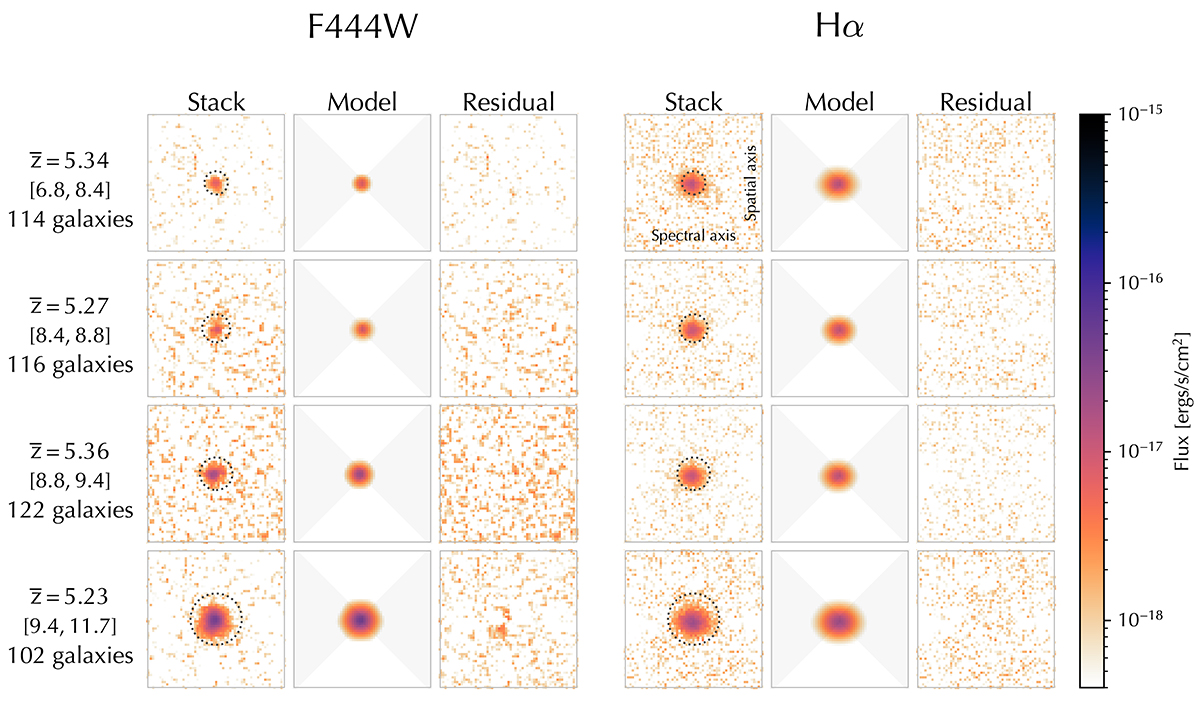
F444W and Hα stacks with their associated GALFIT fits. Models are PSF-convolved single-component Sérsic profiles (see Section 3.2 for more details). Residuals after the model was subtracted from the data are shown in the last column for both F444W and Hα. Each thumbnail is 60 × 60 pixels, where 1 pixel = 0.05″. ![]() is the median grism redshift of each stack, below which the Log(M*/M⊙) range of each stack is shown in square brackets. The colour map is logarithmic, with Hα stacks and fits multiplied by 100 for visibility. The shaded grey regions show pixels that were ignored by the hourglass mask (see Section 3), and the dotted black circles show the region within which surface brightness profiles were measured (see Section 4).
is the median grism redshift of each stack, below which the Log(M*/M⊙) range of each stack is shown in square brackets. The colour map is logarithmic, with Hα stacks and fits multiplied by 100 for visibility. The shaded grey regions show pixels that were ignored by the hourglass mask (see Section 3), and the dotted black circles show the region within which surface brightness profiles were measured (see Section 4).
Current usage metrics show cumulative count of Article Views (full-text article views including HTML views, PDF and ePub downloads, according to the available data) and Abstracts Views on Vision4Press platform.
Data correspond to usage on the plateform after 2015. The current usage metrics is available 48-96 hours after online publication and is updated daily on week days.
Initial download of the metrics may take a while.