Fig. 1.
Download original image
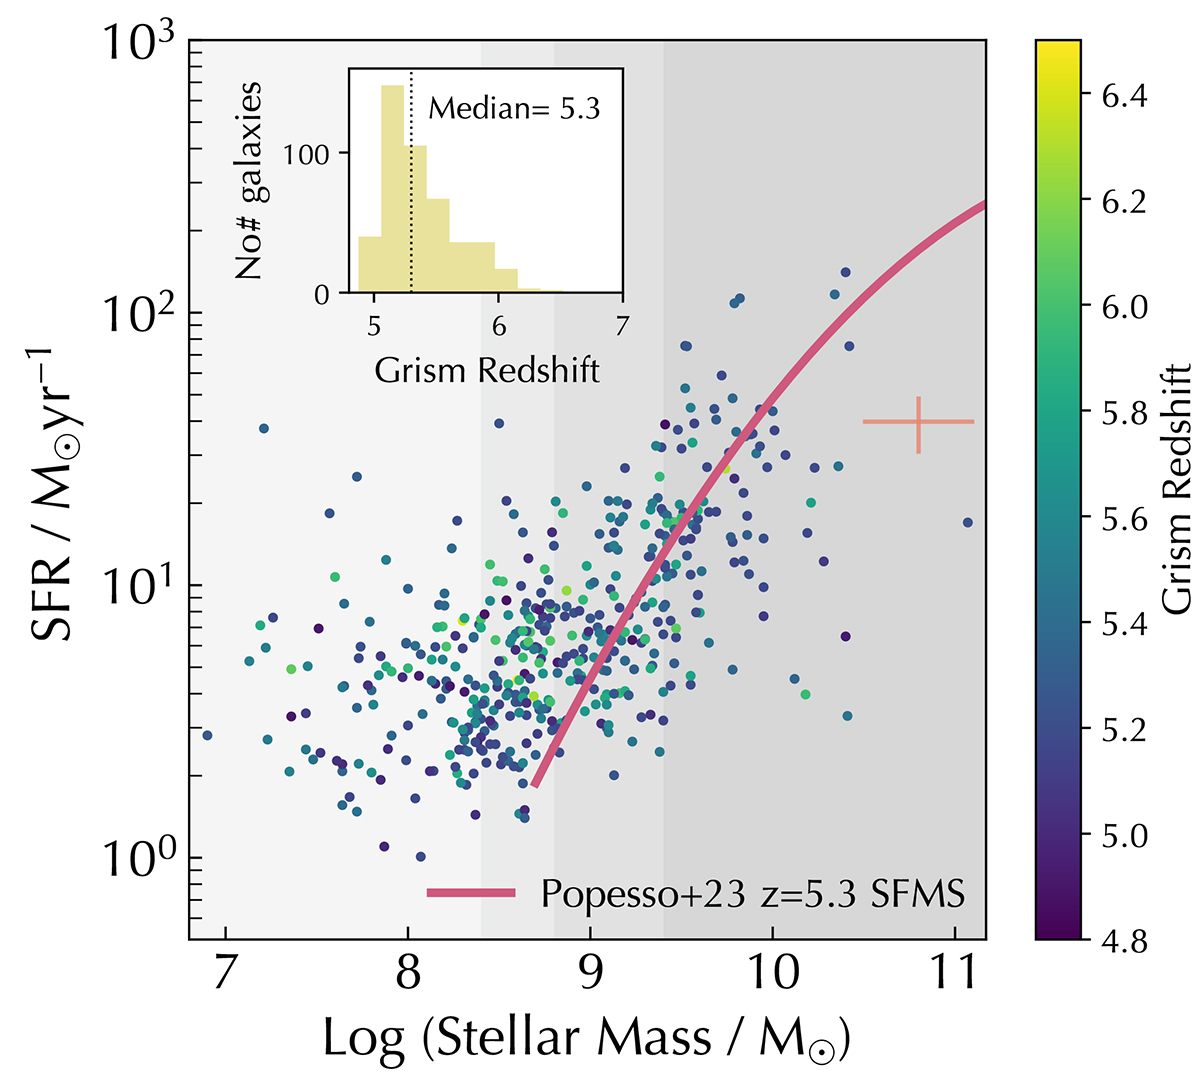
Star formation main sequence of our sample. The shaded grey regions delineate our stellar mass bins for the stacking. SFRs and the Popesso et al. (2023) SFMS include dust corrections (see Section 2.4). The inset plot shows the grism redshift distribution of our sample. The typical measurement error is shown as the orange cross.
Current usage metrics show cumulative count of Article Views (full-text article views including HTML views, PDF and ePub downloads, according to the available data) and Abstracts Views on Vision4Press platform.
Data correspond to usage on the plateform after 2015. The current usage metrics is available 48-96 hours after online publication and is updated daily on week days.
Initial download of the metrics may take a while.