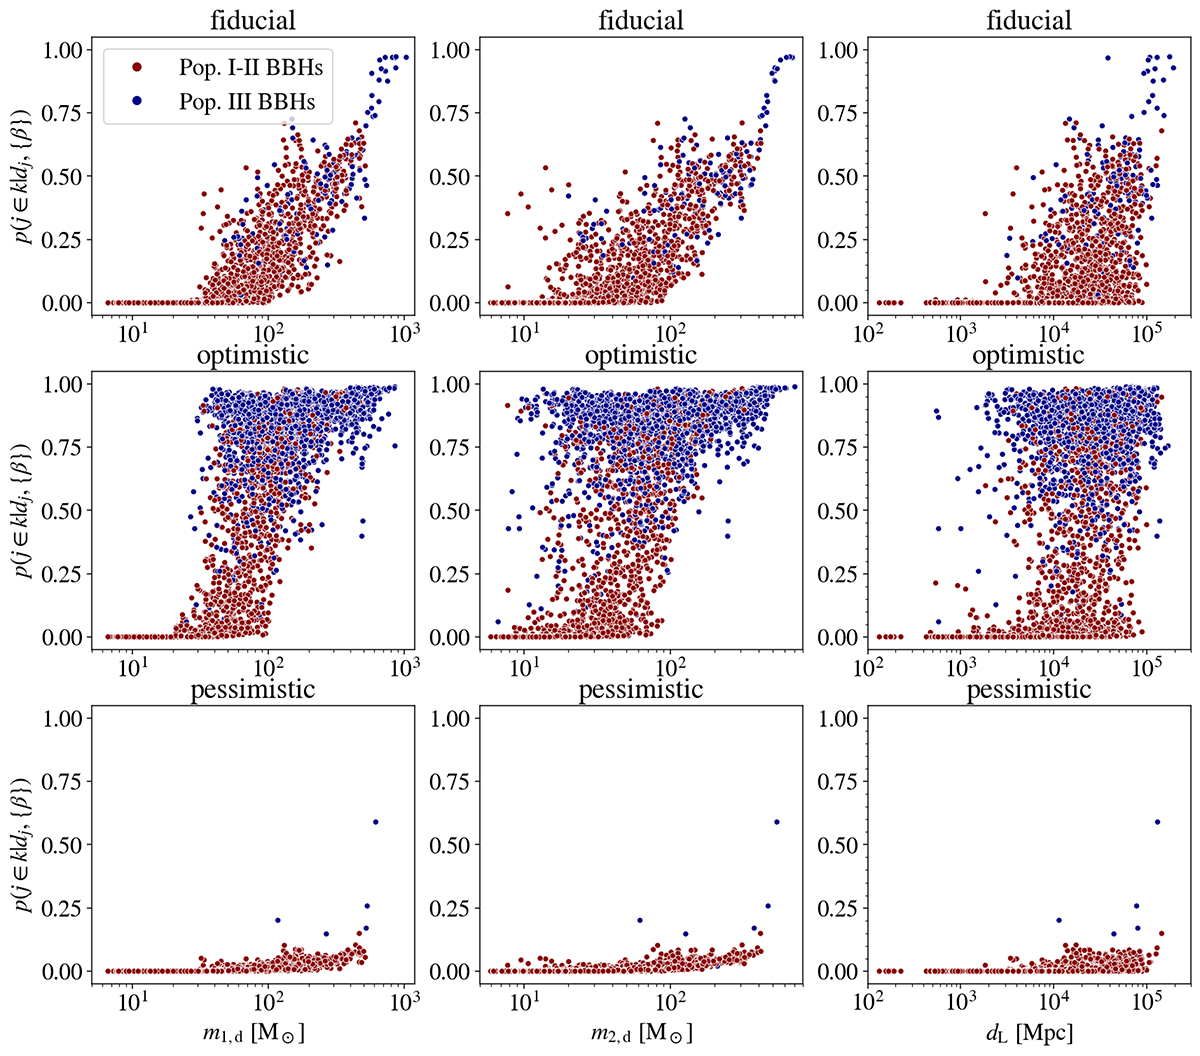
Fig. 7.
Download original image
Probability (p(j ∈ k|dj, {β}) in Eq. (23)) of each mock observation to belong to the Pop. III class in the left to right columns as a function of primary mass (m1, d), secondary mass (m2, d), and luminosity distance (dL). Each dot corresponds to the median of the posterior samples. The top, middle, and bottom rows correspond to the fiducial, optimistic, and pessimistic scenarios, respectively. The red (blue) dots indicate observations known to belong to Pop. I–II (Pop. III). We refer to Sect. 2.4 for details.
Current usage metrics show cumulative count of Article Views (full-text article views including HTML views, PDF and ePub downloads, according to the available data) and Abstracts Views on Vision4Press platform.
Data correspond to usage on the plateform after 2015. The current usage metrics is available 48-96 hours after online publication and is updated daily on week days.
Initial download of the metrics may take a while.