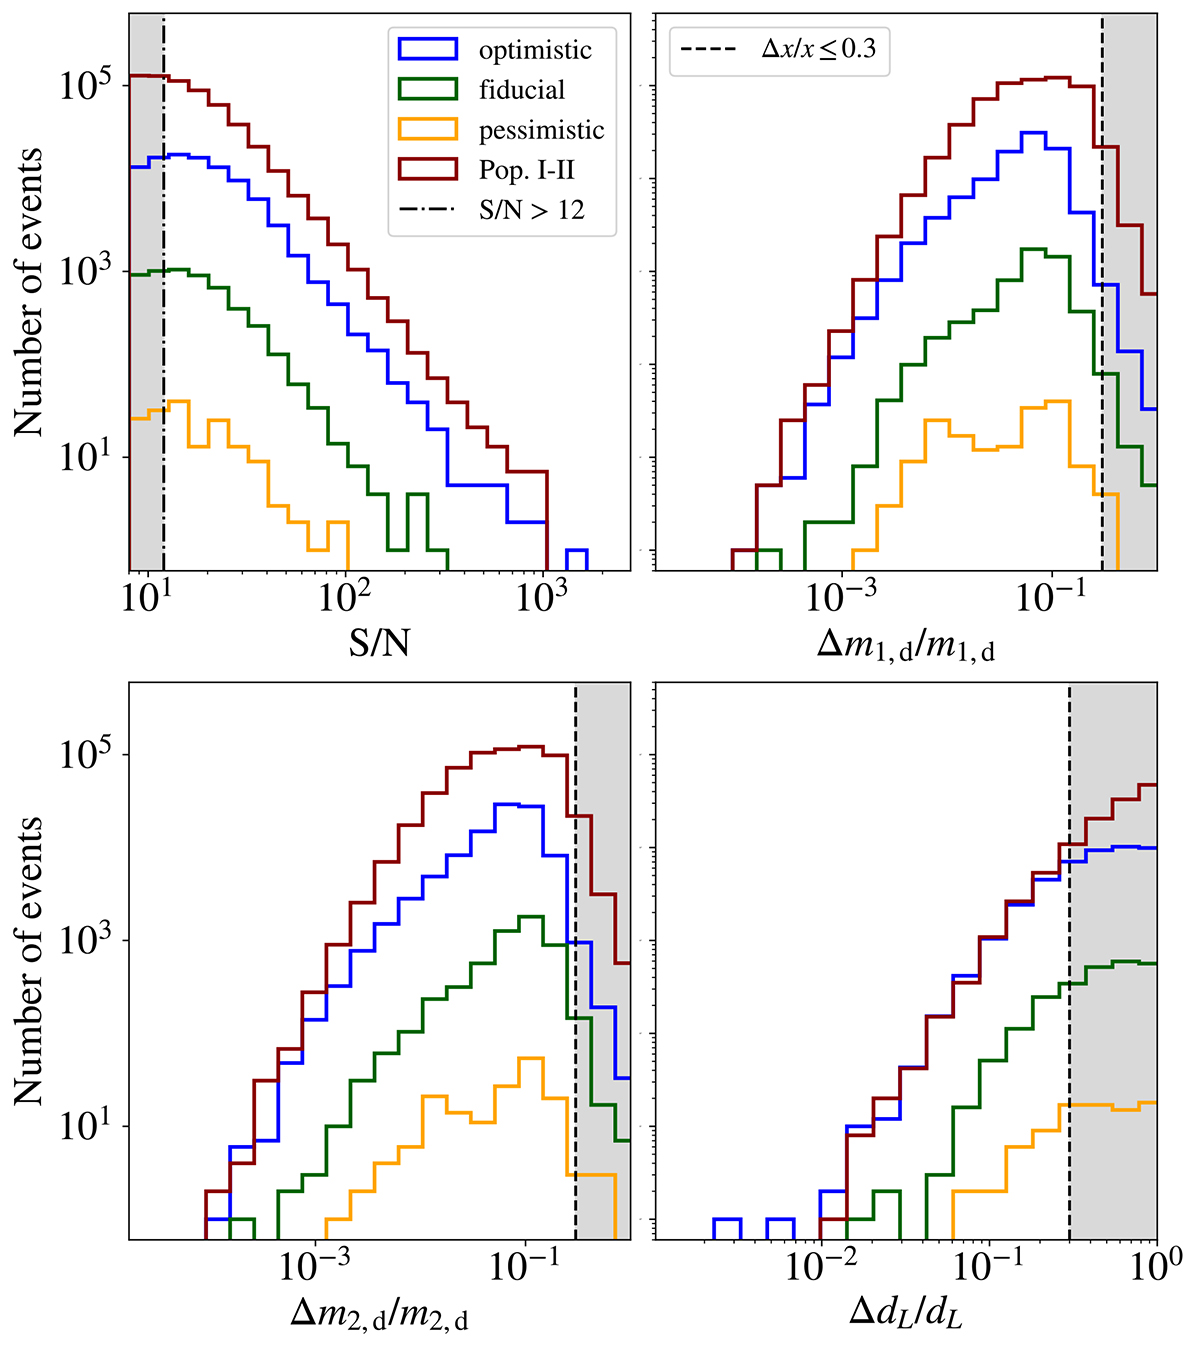
Fig. 1.
Download original image
Distribution of S/Ns (top left panel) and relative errors for detector-frame primary masses (top right panel), detector-frame secondary masses (bottom left panel), and luminosity distances (bottom right panel). The blue, green, and orange histograms correspond to optimistic, fiducial, and pessimistic models for Pop. III BBHs, respectively, and the red histograms refer to BBHs from Pop. I-II stars (see Sects. 2.1 and 2.3 for details). In the top left panel, the dash-dotted black line marks the adopted S/N limit, and the dashed black lines in the other panels represent the adopted threshold for relative errors, where Δx are 1σ errors and x = {m1, d, m2, d, dL}.
Current usage metrics show cumulative count of Article Views (full-text article views including HTML views, PDF and ePub downloads, according to the available data) and Abstracts Views on Vision4Press platform.
Data correspond to usage on the plateform after 2015. The current usage metrics is available 48-96 hours after online publication and is updated daily on week days.
Initial download of the metrics may take a while.