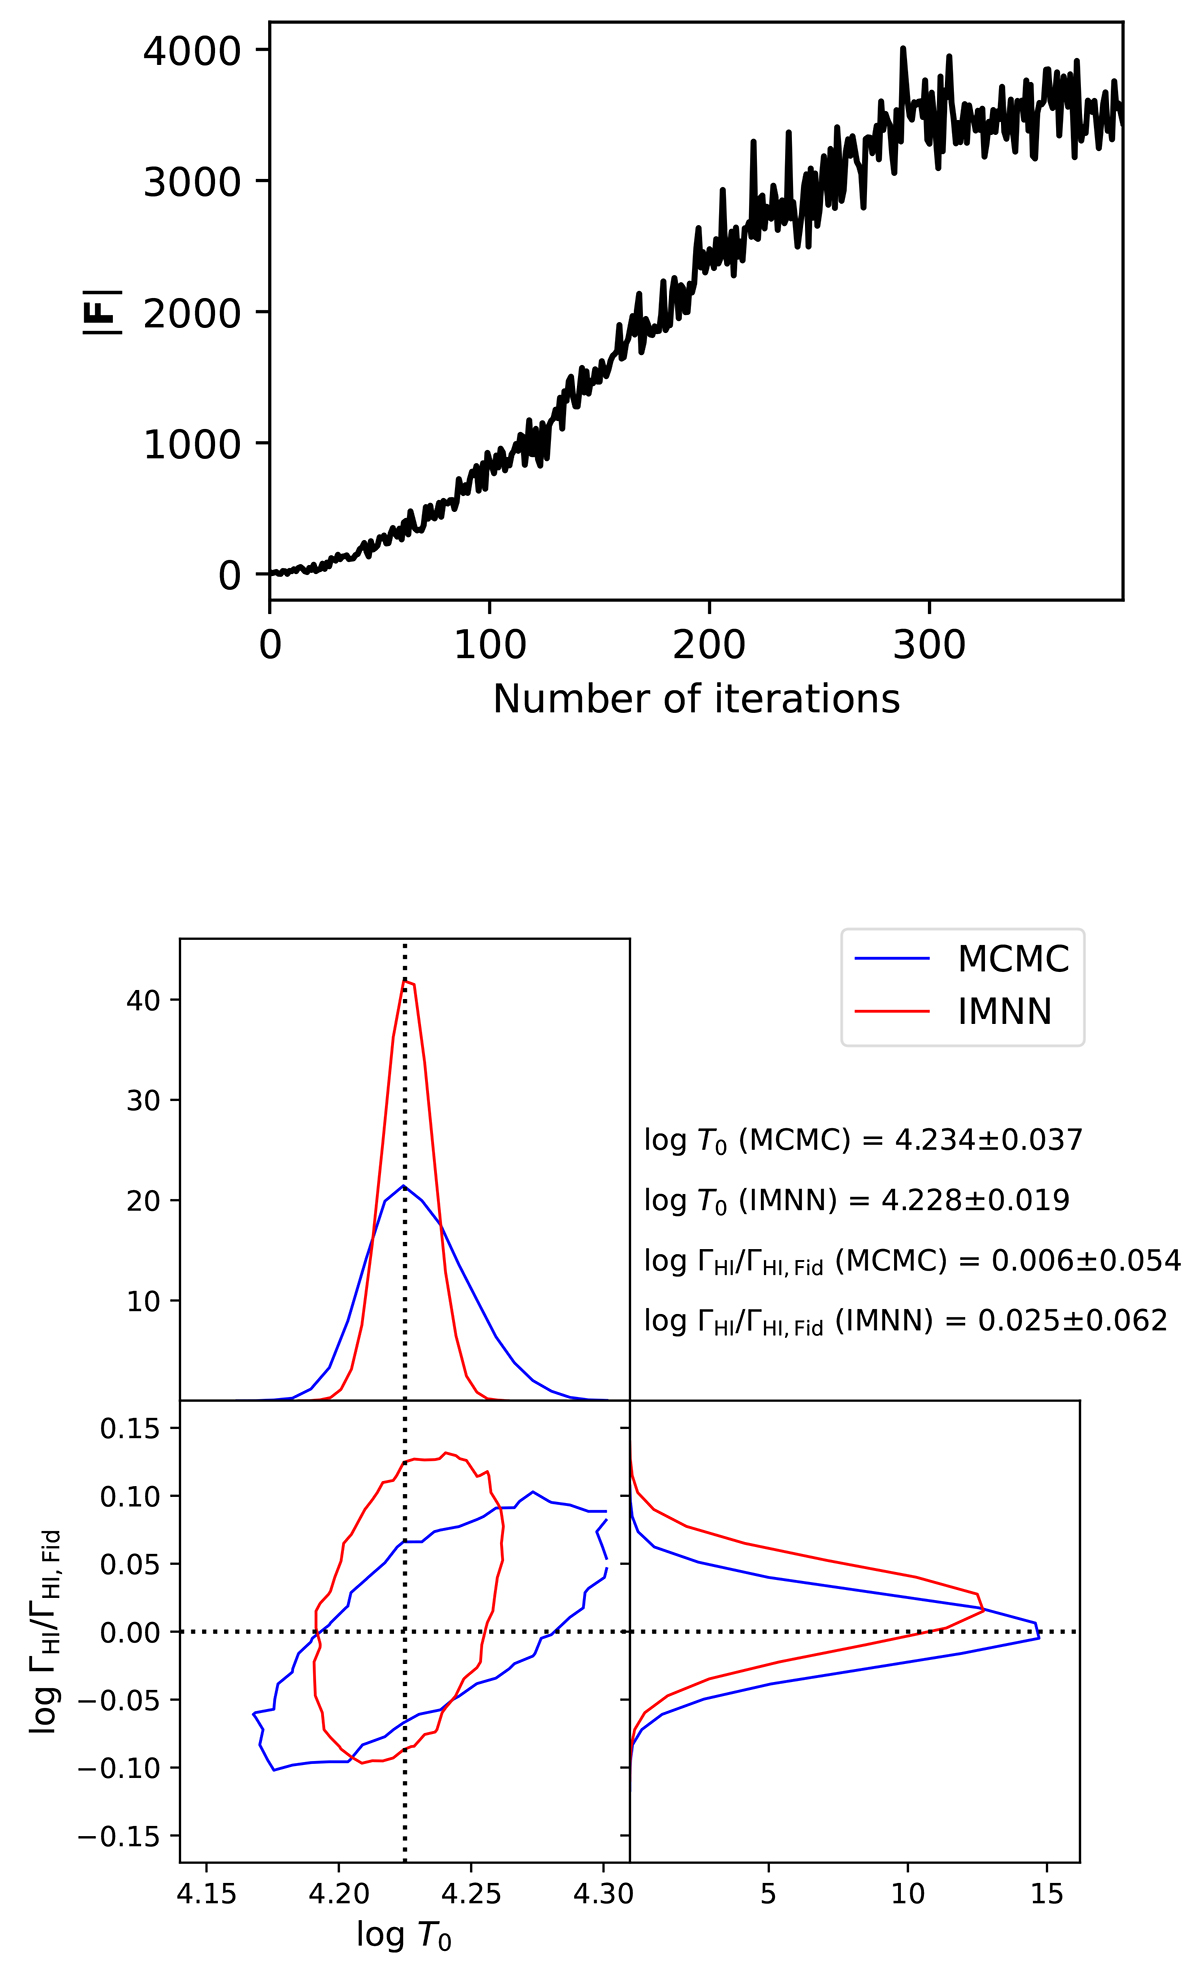
Fig. 7.
Download original image
2D parameter estimation of T0 and ΓHI using IMNN. Top: IMNN training plot (using SimulatorIMNN subclass of IMNN) corresponding to thermal parameter, T0, and H I photoionization rate, ΓHI, for z = 3. The plot shows the evolution of Fisher information during training with the training epoch. Bottom: Contour plots showing the 68% credible region for log T0 and logΓHI/ΓHI, Fid estimates based on the IMNN approach and with MCMC. It is to be noted that in the case of MCMC, the contour plot corresponds to a posterior distribution drawn from running MCMC using a flat prior (see Eq. 4), while in the case of IMNN it corresponds to the distribution of the estimates. Accompanying this are the plots for the distribution functions (for MCMC and IMNN, respectively) for both the parameters log T0 and logΓHI/ΓHI, Fid individually by marginalizing over the other parameters.
Current usage metrics show cumulative count of Article Views (full-text article views including HTML views, PDF and ePub downloads, according to the available data) and Abstracts Views on Vision4Press platform.
Data correspond to usage on the plateform after 2015. The current usage metrics is available 48-96 hours after online publication and is updated daily on week days.
Initial download of the metrics may take a while.