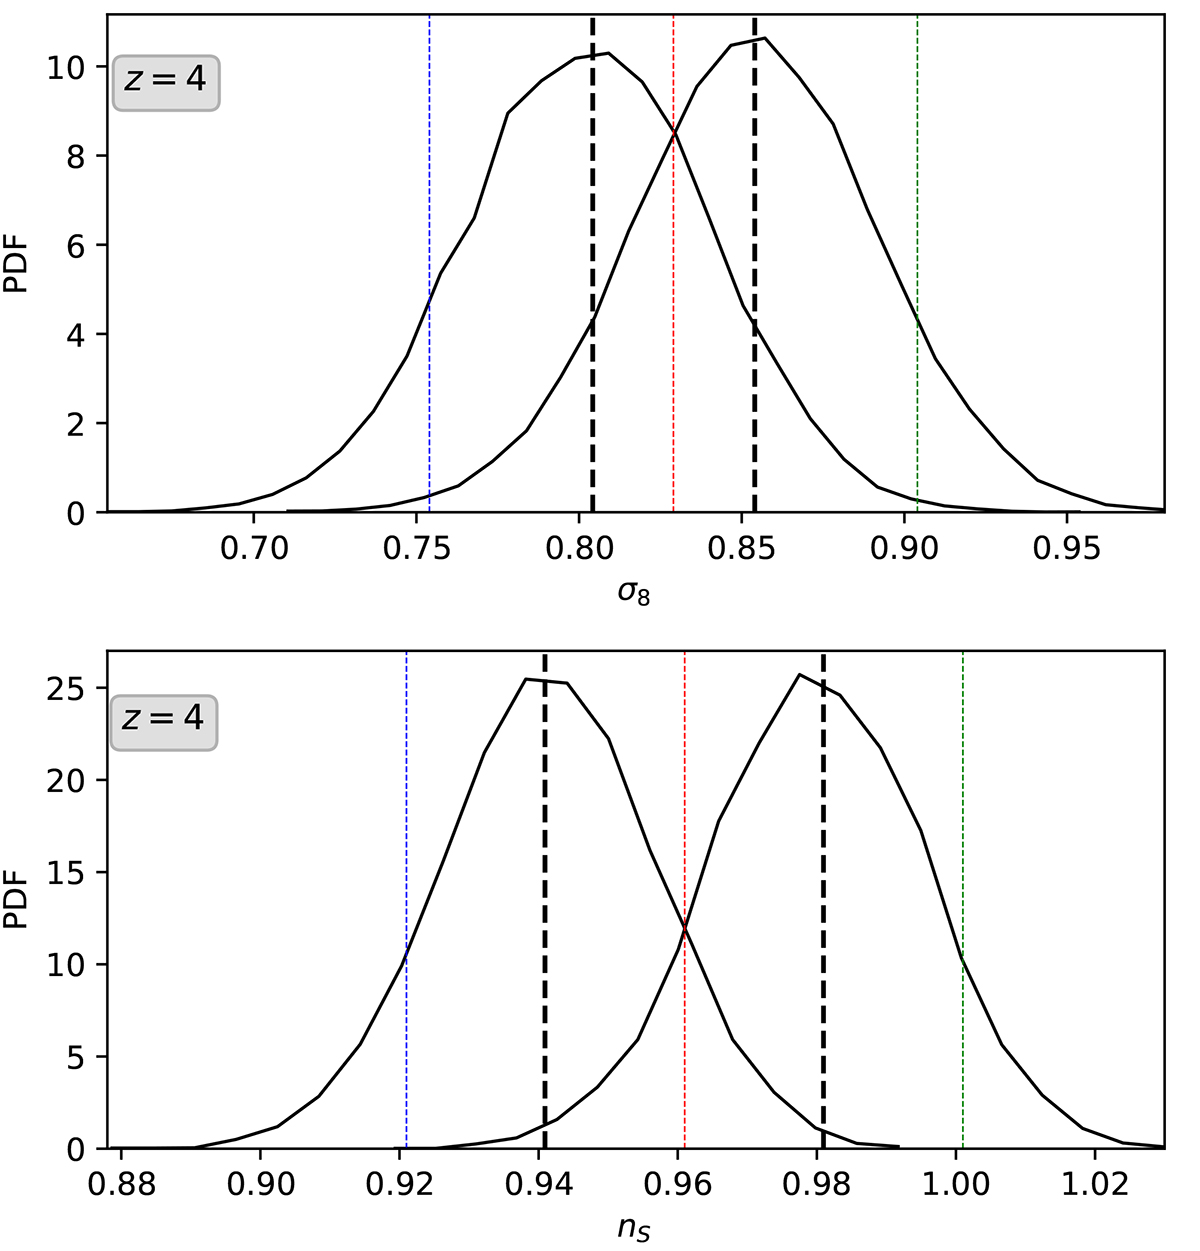
Fig. 5.
Download original image
Estimation of σ8 and ns at z = 4 for parameter values (two dashed black lines) different from the parameter values with which the IMNN has been trained (dashed blue, red, and green lines). The black curves show the PDF of the estimated parameter values (at two different values). Each realization in the distribution of the estimated parameters is a bootstrap realization of a sample size of 50 mock spectra over the entire testing set. The distributions of the parameters were generated with 10 000 bootstrap realizations for each parameter.
Current usage metrics show cumulative count of Article Views (full-text article views including HTML views, PDF and ePub downloads, according to the available data) and Abstracts Views on Vision4Press platform.
Data correspond to usage on the plateform after 2015. The current usage metrics is available 48-96 hours after online publication and is updated daily on week days.
Initial download of the metrics may take a while.