Fig. 2.
Download original image
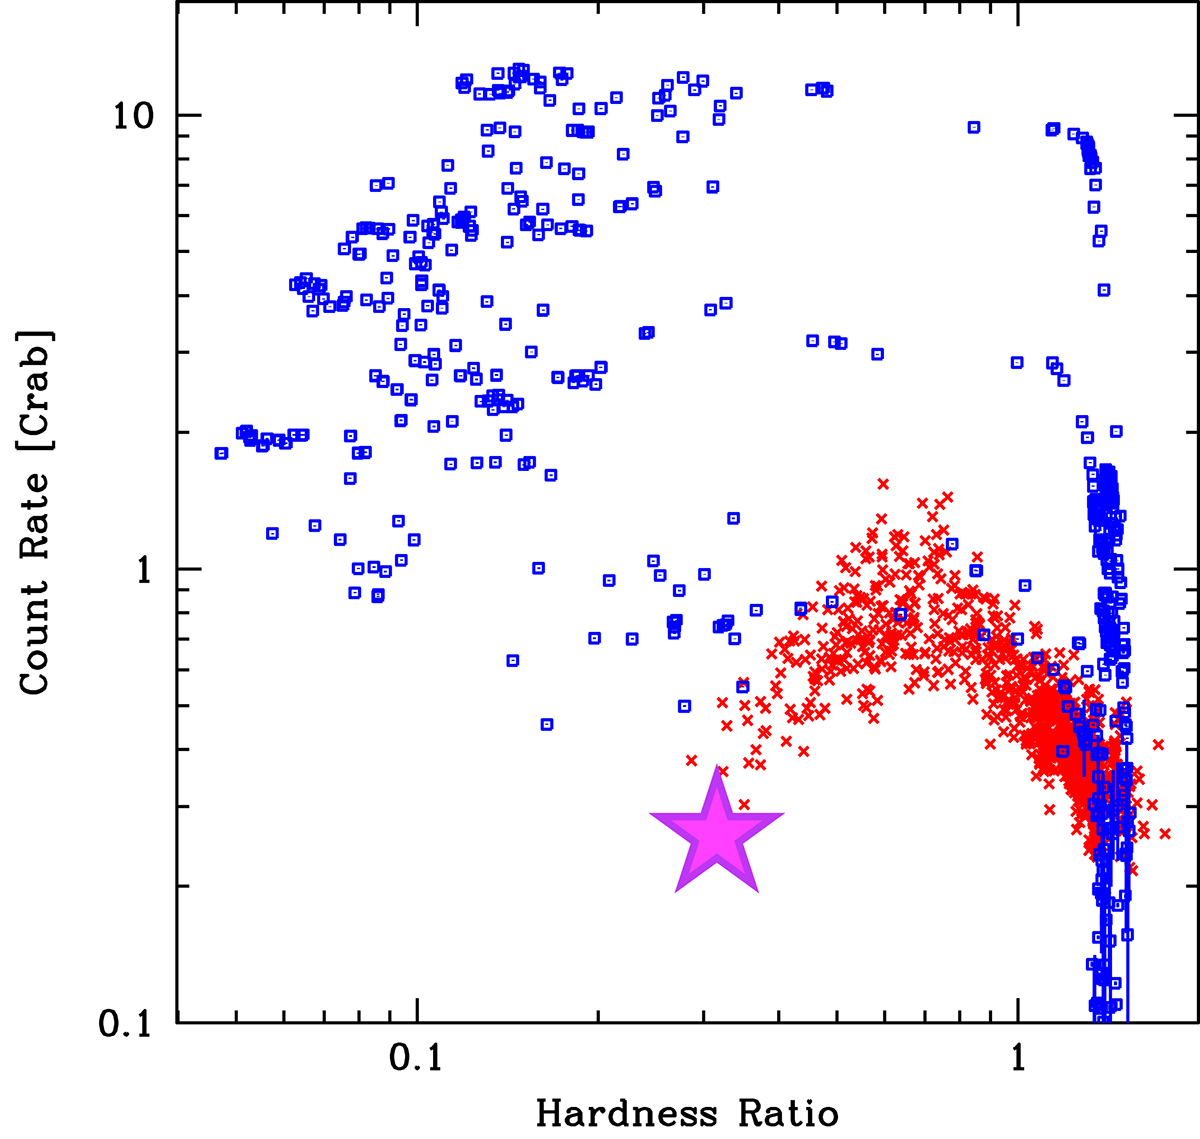
The spectral hardness versus intensity diagram for all the RXTE data to 2005 from GX339-4 (blue) and Cyg X-1 (red), shifted in intensity so that the transition from soft to hard overlapped. Hardness ratio is defined as the ratio of counts in the energy bands 6.3–10.5 and 3.8–6.3 keV. (Data from Belloni 2010.) The Cyg X-1 Suzaku data used here is shown as the magenta star.
Current usage metrics show cumulative count of Article Views (full-text article views including HTML views, PDF and ePub downloads, according to the available data) and Abstracts Views on Vision4Press platform.
Data correspond to usage on the plateform after 2015. The current usage metrics is available 48-96 hours after online publication and is updated daily on week days.
Initial download of the metrics may take a while.