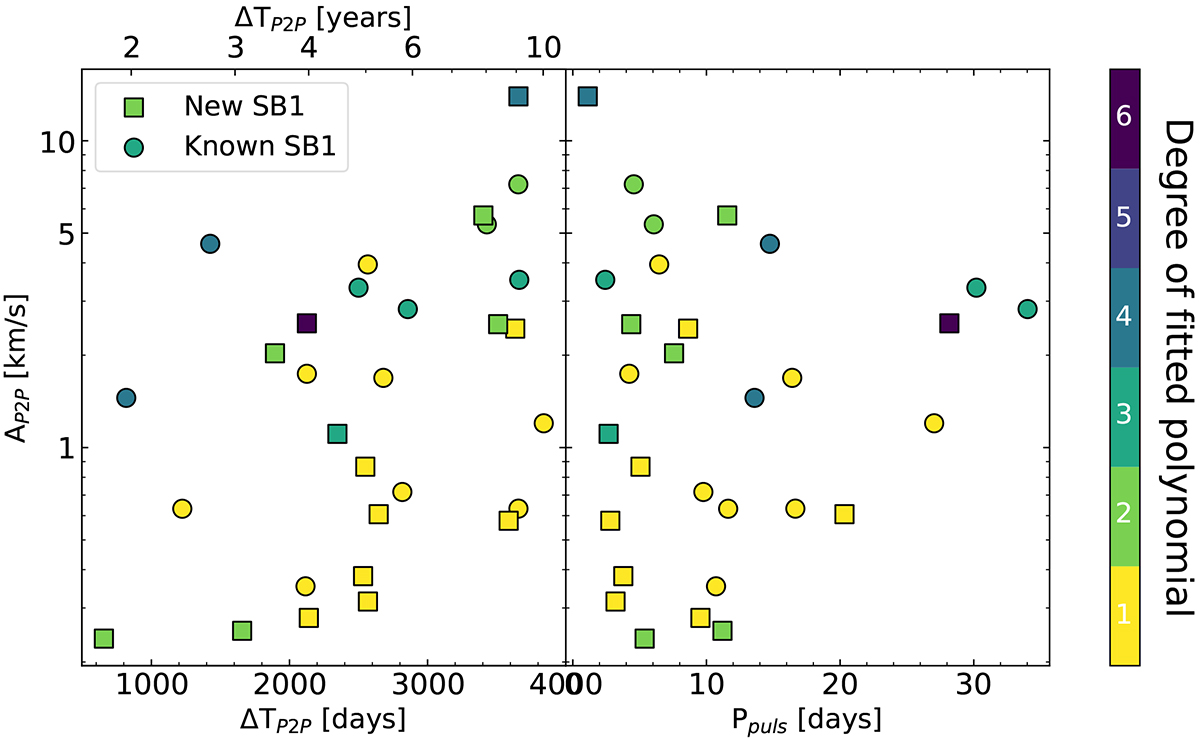
Fig. 6.

Download original image
Distribution of Ap2p, maximum amplitude variation in vγ, for the stars in our sample where we could fit a polynomial to the vγ trend (see Section 3.3 for details). In the left panel, we have the Ap2p vs the baseline in time over which it was calculated and in the right panel, the same against the pulsation period. The newly discovered SB1s from our sample are plotted in filled squares, while the literature-known SB1s are plotted in filled circles. The color bar represents the degree of polynomial fitted in the Fourier+Polynomial model.
Current usage metrics show cumulative count of Article Views (full-text article views including HTML views, PDF and ePub downloads, according to the available data) and Abstracts Views on Vision4Press platform.
Data correspond to usage on the plateform after 2015. The current usage metrics is available 48-96 hours after online publication and is updated daily on week days.
Initial download of the metrics may take a while.


