Fig. B.1.
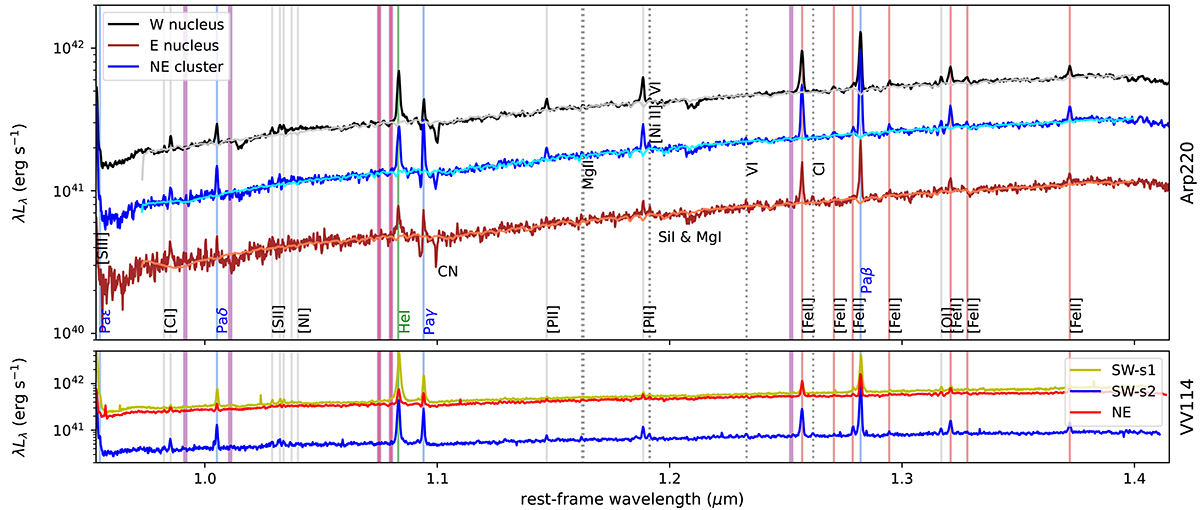
Download original image
0.95 − 1.42 μm portion on the spectra of the Arp 220 and VV114 nuclear regions. The spectra are shown in luminosity as a function of the rest frame wavelength, considering the redshift of each region. The grey, cyan and orange curves represent the pPXF best-fit. The vertical blue lines mark the position of hydrogen transitions; the orange lines identify H2 lines; the red lines are associated with [Fe II] transitions; the green lines mark He I features; solid vertical lines mark the position of faint metal lines; potential identifications are indicated with dotted vertical lines. The positions of highly ionised gas transitions are indicated with narrow vertical bands in purple. In the figure, we also indicate the position of strong stellar absorption features.
Current usage metrics show cumulative count of Article Views (full-text article views including HTML views, PDF and ePub downloads, according to the available data) and Abstracts Views on Vision4Press platform.
Data correspond to usage on the plateform after 2015. The current usage metrics is available 48-96 hours after online publication and is updated daily on week days.
Initial download of the metrics may take a while.