Open Access
Fig. A.1.
Download original image
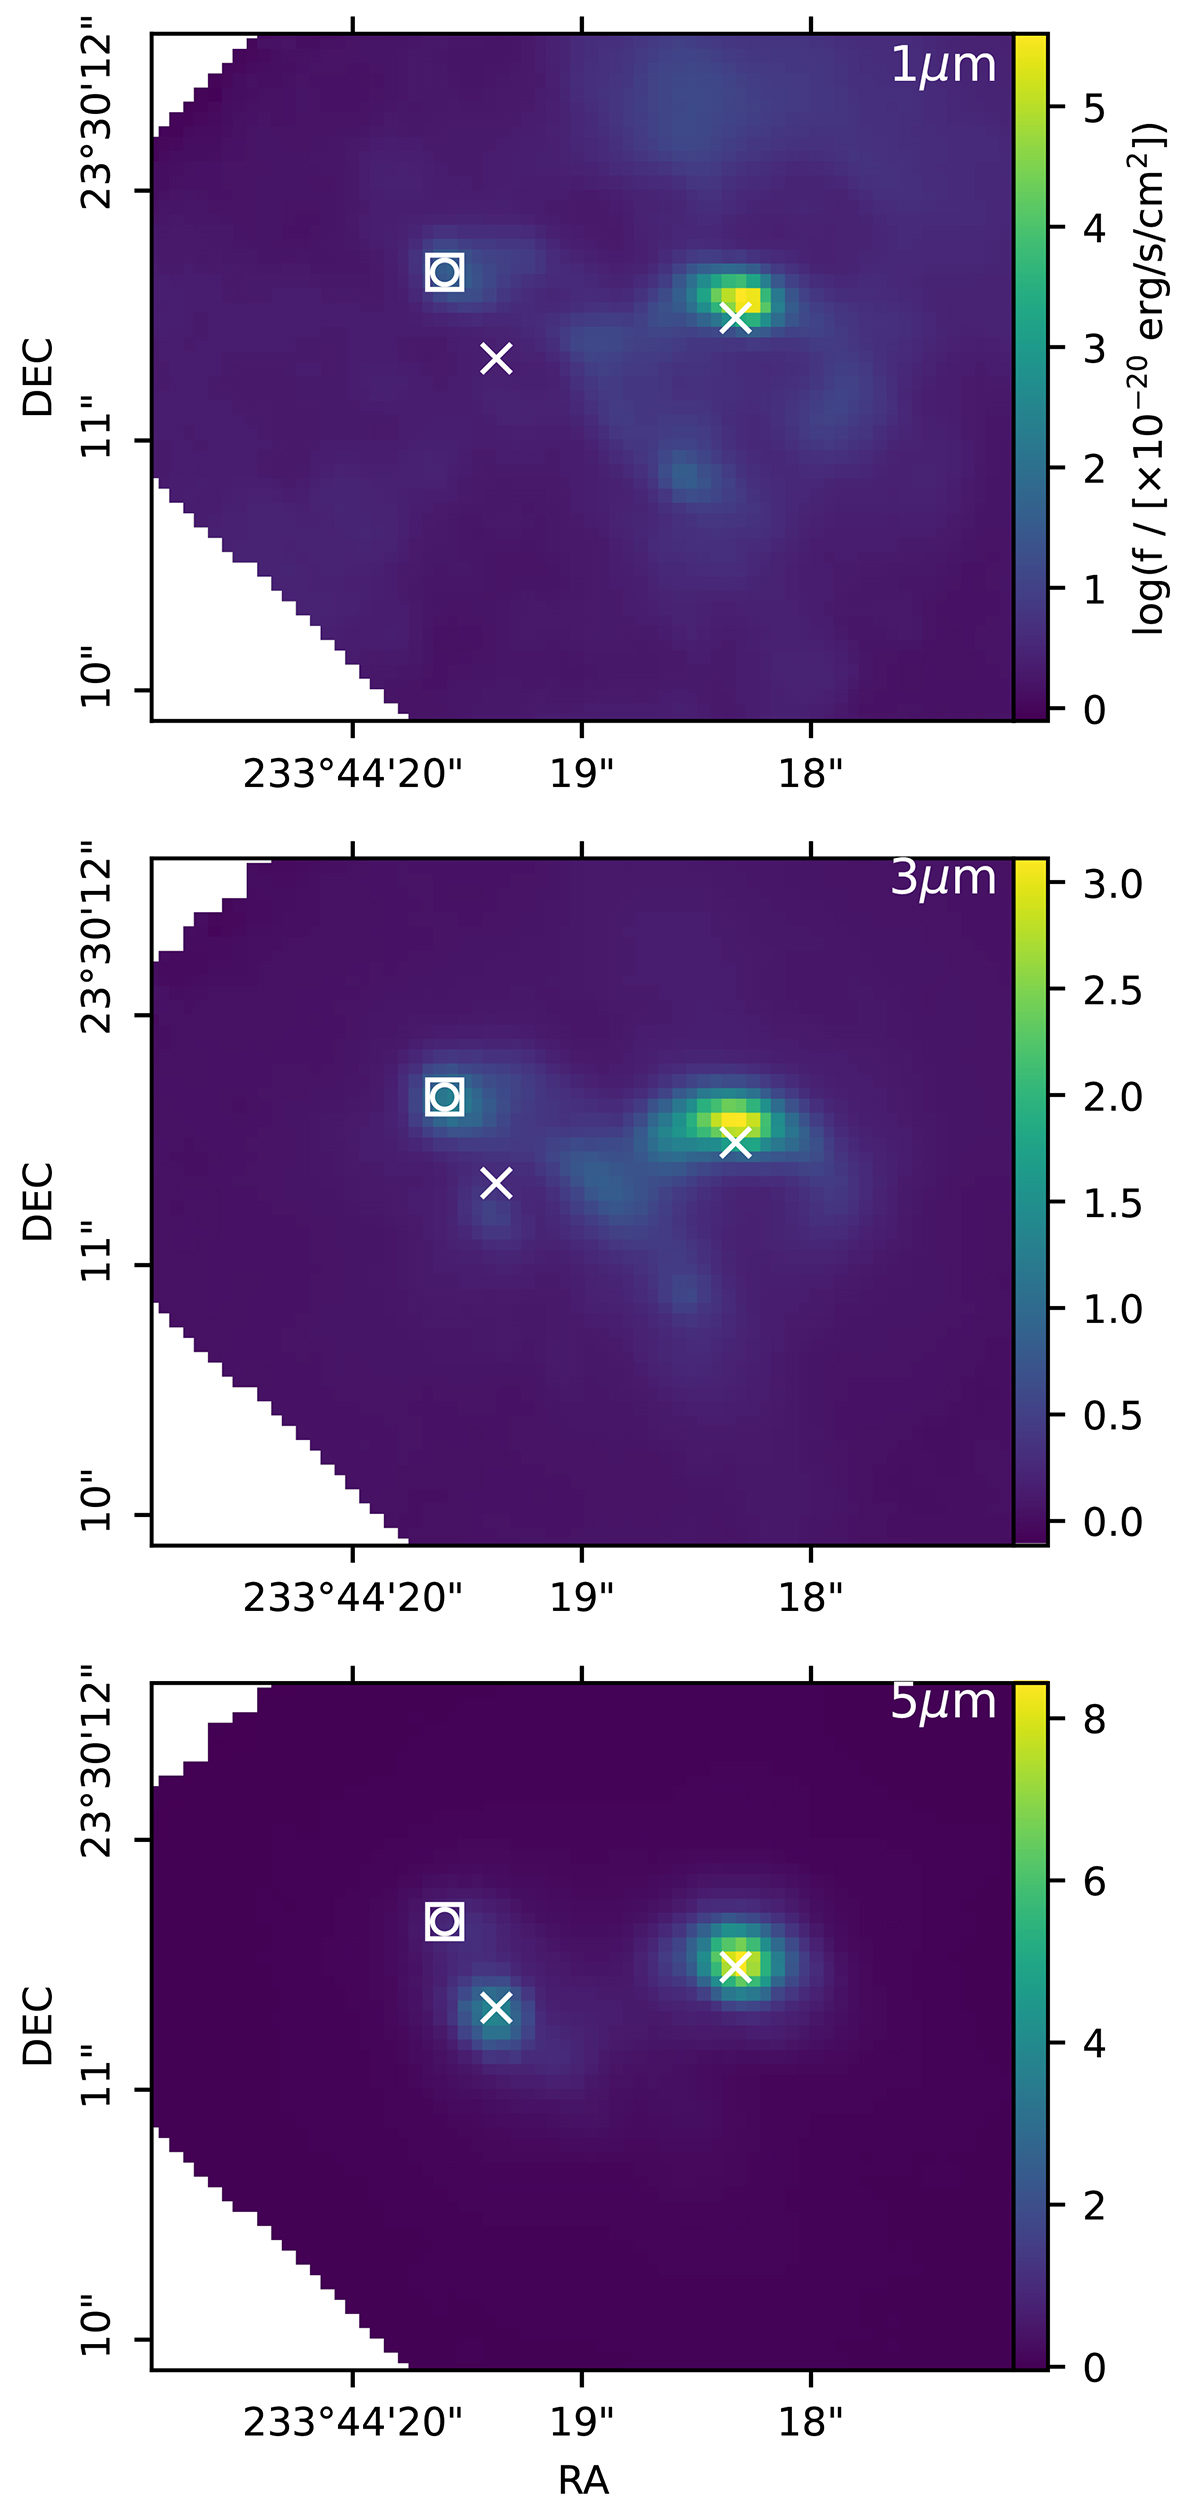
NIRSpec narrow-band images tracing the continuum emission at ∼1 μm (top), 3 μm (centre) and 5 μm (bottom). The position of the W and E nuclei are marked with X symbols; the box-circle symbol marks the position of the bright NE cluster (see also Fig. 1)
Current usage metrics show cumulative count of Article Views (full-text article views including HTML views, PDF and ePub downloads, according to the available data) and Abstracts Views on Vision4Press platform.
Data correspond to usage on the plateform after 2015. The current usage metrics is available 48-96 hours after online publication and is updated daily on week days.
Initial download of the metrics may take a while.